Index
- CCD Temperatures
- Clock Temperatures
- Focal Plain Assembly Temperatures
- HOPA Temperatures
- Spider and Secondary Mirror Temperatures
- AEB Temperatures
- CEB Temperatures
- Aft Temperatures
- Forward Temperatures
- Front Aperture Assembly Temperatures
- GT Temperatures
- Spacecraft Bus Voltage
- Bus Current
- Motor Currents
- Secondary Voltages (3 & 5 V)
- Secondary Voltages (15 & -15 V)
- Secondary Voltages (78 V)
- ISS Diode Voltages
- Filter Wheel Move Times
- Aperture Selector Move Times
- Shutter Open Times
- Shutter Error
- Shutter Exposure Times
- Dark Currents
- DATAMEAN
- NPACKETS
- NSPIKES
- DATAMIN
- Mean pixel value
- AIA-EVE Plot ratio
- Camera Gain Settings
- Camera Offset Settings
- ISS Error
- PZT Gains
- Telescope Pointing
- Filter Health
- Filter Ratios
- Clock Increment
- Corrupt Images
- Focus
- AIA Readout Errors
- AIA Frame Errors
- AIA Camera Link Not Ready Errors
- The CCD Bump: About 3 weeks or so before the start of eclipse season, you will see a daily "bump" and allover "boost" in the temperature profile of the CCDs. The effect is visible in other temperatures as well, but is most pronounced in the CCD plots. The AIA bump starts showing a day before the HMI bump does.
- Jump in temps on Jan 18 @ 14:15UT is likely due to an FPA temp adjust (05/22/2012)
- In September 2010, the deadbands were tightened to put the FPA heaters into "bang-bang" mode. This flattened out the temperature profile.
- The inner ATAs (2 & 3) have flatter temperature profiles than the outer ATAs (1 & 4).
- The step function in ATA 4 on 26-Aug-2011 was an affect of increasing the ATA 4 aft telescope temperature by 5 degrees in preparation for the ATA 4 bakeout.
- Temperature adjustment to aft heaters which likely caused small rise in CCD temps (05/22/2012)
- 201308 - Several areas (e.g. FPA, Spider, etc.) show the effect of various heater adjustments we've made, which has made it a little harder to pull out true long-term trends. The last heater adjustment was around November 26, 2012, when we raised the front zone on ATA3 to maintain heater control (we didn't remember this during the review, but I read the email trail afterwards and it came back to meÉ) Leaving the heaters alone for a year or so will make the trending easier.
- The elephant parade diagram (best seen in the CEB temperatures) is likely due to some change in illumination of the spacecraft geometry; we rediscover it during each trending review, but it doesn't seem to be worth worrying about.
- The HOPA temperatures show a constant upward trend, (especially in ATAs 1 and 3), that is thus far unexplained.
- The current yellow high limit is 70 for ATAs 2 and 4, and 75 for ATAs 1 and 3. Jake says "Dave and I probably took one HOPA to about 85 when trying ot break it."
- We will continue raising the yellow limits on the HOPA temperatures as necessary in order to avoid tripping a limit.
- Still need to determine when we should be concerned (Carl Yanari). What can we do about it? (02/21/12)
- The upward trend appears to level off for ATA 1, as indicated by the two peaks at 2016-Jan and 2017-Jan both at ~76 C. The other three ATAs are below 65 C, currently climbing at ~1 C/year, and also showing a sign of slowdown. If 85 C (from the above notes) is a nominal upper limit, then we will probably be fine for, perhaps at least another 10 years. (Wei Liu & Scott Green 10/24/2017)
- The ATA 4 temperature increased on 17-October-2011 because we raised the front telescope temperatures slightly at this time in order to keep them under deadband control.
- Aft end warming on Jan. 18th make spiders temps rise. (05/22/2012)
- What is the end temp expected? (Carl). (04/17/2013)
- Don't want the temps to get higher than 40's. (04/17/2013)
- N/A
- There appears to be a geometric affect on the temperature range/scatter. This could be due to handover season, and/or the orientation of the CEB radiator.
- What do the dips correlate with? Jake says: Looks seasonal to me given that the two dips are in July; so imagine we've another one coming up soon.
- The spikes are from off point maneuvers and cadence slow downs which both cool the CEB. (08/20/2012)
- 201308 - The elephant parade diagram (best seen in the CEB temperatures) is likely due to some change in illumination of the spacecraft geometry; we rediscover it during each trending review, but it doesn't seem to be worth worrying about.
- Aft temperatures were increased to keep everything warmer. Possibly revert this increase (05/22/2012)
- Paul says probably done tweaking now (04/17/2013)
- Bumped to keep the temeratures under our control. (05/22/2012)
- The bump was done on Dec. 12, 2011. The log states it was for keeping them under our control and this was the change:
Increased ATA 1 & 2 Fwd temps:
ATA 1 from 36.1 to 37.0 degrees
ATA 2 from 30.3 to 31.0 degrees.
(08/20/2012) - Perihelion generally creates a need to change these temps (04/17/2013)
- There is a slight upward trend in the FAA temperatures due to degradation.
- There is a slight upward trend in the GT temperatures due to degradation.
- The spacecraft bus voltage is raised from 31.5 V to 33.1 V for each eclipse season.
- The change is usually made a few days prior to the first eclipse.
- The jumps in bus current are likely due to binning errors. Emma and Rock are investigating whether or not these artifacts can be eliminated. (11/23/11)
- What happened the end of March 2011? No idea what happened is the consensus. (02/21/12)
- 201308 - There's a spike up in the AIA bus current at the end of the plot, which might be worth looking into, though it's certainly a plot glitch and not real data.
- Average max current changed from 250mA to 275mA on about June 15, 2011. No concern, overall average stayed the same. (05/22/2012)
- After the 2016-Aug-02 loadshed, the max motor current pattern changed a bit, with the top bright band dropping from 340 to 320 mA on 2016-Aug-09 (after the reboot with version 20-13 FSW). HMI had a similar change in its max motor current on 2016-Aug-4 upon its reboot. The mininum current dropped slightly from ~4 to ~3 mA on 2016-Aug-19, perhaps related to the change of GT 3 offset range to "Max" (from "Min") at 18-Aug-2016 18:34 UT??? These are best seen in the 2016-Aug monthly plot in the archive. The exact reason for these changes is unclear. However, the average current remains at the same level before and after the loadshed. So nothing concerning. (Wei Liu, 10/24/2017)
- Early on in the mission the motors were not running as much. This is apparent in the mission- long plot.
- We can see the maneuvers/eclipse affects. (02/21/12)
- It looks a little bit like the 15 V (blue) monitor is trending downward, but it is hard to tell for sure. This could be related to the temperatrue of the electronics box.
- The jump in the 15 V Mech monitor (red) in May corresponds to when we first started running the sequencer (and using the motors).
- Early on in the mission the motors were not running as much. This is apparent in the mission- long plot.
- PZ diode is low for all four ATA because GT to ST is off in the same direction. (08/20/2012)
- The top two tiers are the clockwise and counter-clockwise moves
- The lower, thinner tier is due to the weekly calibrations.
- The August 2011 mission-long plot starts in April instead of March because of a discontinuity in the housekeeping telemetry database.
- It seems to be breaking in and leveling off. (04/17/2013)
- The mechanisms are slightly temperature-sensitive because the wire resistance is temperature-dependent, and the resistance, along with friction, affects the torque on the motors.
- The eclipse seasons are evident.
- Changes with temperature adjustments (warm ups)? Moves faster as temperatures increase. Jake says: Seems like the break is when we heated the aft ends; as you are implying. More explanations, such as this would be useful (if correct). (02/21/12)
- N/A
- ATA2 has two and ATA3 has four different exposure times which give the errors of +/- a few seconds due to timing mismatch. This should be fixed with the new lev0 database method. (08/20/2012)
- Shutter error seem to be increasing in "scatter" over time. What is the cause for this? (11/29/2012)
- The two bands could be due to clock-wise vs counter-clock-wise travel times. (04/17/2013)
- 201308 - The shutter error plots would be more useful with scaling fixed to +/- 5 ms or so.
- This is the average of the shutter timer register values for the following parameters:
- AIA_IMG_SH_CLOSE_BOT_CENTR - AIA_IMG_SH_OPEN_BOT_CENTR
- AIA_IMG_SH_CLOSE_BOT_EDGE - AIA_IMG_SH_OPEN_BOT_EDGE
- AIA_IMG_SH_CLOSE_TOP_CENTR - AIA_IMG_SH_OPEN_TOP_CENTR
- AIA_IMG_SH_CLOSE_TOP_EDGE - AIA_IMG_SH_OPEN_TOP_EDGE
- Would expect to see more variation? Similar in the 193 channel and others? Jake says: I'm guessing you mean due to the AEC and how we see variation in the monthly but not in the longer plots. Perhaps due to infrequent sampling? Or "worse yet" due to some sort of averaging. (02/21/12)
- Also noticed that the full range plots are not showing as expected. For example for the month of March 2012, the year long plot shows no points ~1.0 in March, but the month long plot shows ~5 around 1.0. The cause of this is that for different domain plots (mission, year, month) have different cadence sampling rates: mission: 1 day, year: 12 hour, month: 1 hour. Should they be plotted with the same cadence? (05/22/2012)
- The plot shows data between 1900 and 1901 UT for each day between 1 May 2010 and 25 May 2011 (not daily averages).
- The AIA data are taken from the DATAMEAN keyword in the FITS headers of the aia.lev1 and lm_jps.aia_lev1_pb data series. All images in a given AIA channel use the same flat fields, dark frames, and despiking algorithms for all dates in the time series.
- The EVE data include the version 2 degradation correction released on Feb 22, 2011.
- The EVE data used for the comparison are the EVL_L2_* files (i.e. the band irradiance data product, not the spectral data). These are generated by the EVE team, using level 1 spectral data, which has a higher spectral resolution in the AIA wavelength range than the publicly-available level 2 spectral data.
- The 304 signal in AIA images has been declining, and therefore the drop in the AIA/EVE ratio for the 304 channel is not (solely) due to overcorrection of EVE degradation
- The signal level in the 304 channel is lower than that of the 193, 211 and 171 channels, and therefore it is less likely that CCD burn-in due to high EUV dose is responsible for the drop in the 304 sensitivity
- 201308 - Both the 304 and 335 appear to be below half their initial sensitivity and still dropping; however, between the slowness of the ongoing decline, our uncertainty over the long-term accuracy of EVE's calibration, and our hesitation to disturb things when the flatfield, calibration, and operations are all running fairly smoothly, we concluded that no bakeout was warranted in the near future.
- The camera gains all briefly went to zero on May 18, 2010 due to a flight software load and reboot.
- The camera 4 gains went to zero briefly on 3-Dec-2010, and again on 26-Aug-2011, due to steps taken to recover from the "Invalid data from camera 4" anomaly.
- The general step up starting around September 2011 due to pinhole hits that cause super-saturation in the front filter check calibration. The charge built up by the super-saturation is not cleared out completely when the darks are taken. (04/17/2013)
- What is the cause of the "linear" increase on camera 4? Possibly due to the CCD not clearing the charge as efficiently over time? (04/17/2013)
- 201308 - The mean dark current plot should be tweaked to 1) only include the standard "daily" darks, and 2) use a fixed range centered on the pedestal value of each camera (with the 4 cameras offset from each other).
- 201308 - There is a bump upwards in the baseline of the Dark RMS in March 2013; not sure what caused that.
- This is a plot of every hour's median NPACKETS.
- 201308 - The mission-long and year-long seem not to agree; the year-long plots look flat/low through the spring, while the mission-long has a secondary peak there.
- 201308NPACKETS needs a fixed range (and, perhaps, log scaling?) in order to capture modulation of the baseline and not just outliers.
- Note that the despiker does not run on UV channels, so these show values of zero.
- One year trend is possibly due to combined geometric effects of spacecraft orientation and directional cosmic ray fluxes. (08/20/2012)
- 201308 - Should remove the UV channels from the NSPIKES plots,
- This is a plot of how many times each hour the DATAMIN was less than 100.
- The 2017-Sept monthly plot shows a close temporal correlation with the GOES >100 MeV proton flux over three days (Sep-10 16:00 to Sep-13 00:00 UT), following the Sep-10 X8.2 flare. This suggests such high-energy particles hitting the instrument caused the abnormally high rate of DATAMIN<100 occurrences. Another high rate (>100 occurrences/hour) in the mission-long plot was early 2012, perhaps on 2012-Mar-07, following the X5.4 flare. (Wei Liu, 10/24/2017)
- Since 2014-Apr, the ATA 4 curve (best seen in the monthly version) appears to be shifted in time and lead the other ATAs by about 3.5 days. This is likely due to a bug in the plotting code or a hiccup in the trending database. (Wei Liu, 10/24/2017)
- The 1700 A channel shows an annual variation or about 7% due to the changing size of the sun on the CCD.
- The degradation in the 304 channel has been recognized, but thus far is not understood. See AIA03821 "Memo on Sensitivity Loss in AIA 304 Channel" for more information.
- Smaller variations in the datamean are likely a reflection of changes in solar activity.
- Discontinuity in 1600, 1700 due to flat field update. Downward slop due to solar period (05/22/2012)
- Flat field change only visible for lev1 and wont be noticeable at lev0. (08/20/2012)
- Decline in DATAMEAN: Jake says, bright limb burns in the CCD and results in lower sensitivity. (11/29/2012)
- N/A
- N/A
- Two plots are displayed. Both plots show the same data, with different y-axis ranges:
- The top plot shows the full y-range, so that maneuvers and other off-points are apparent.
- On the bottom plot, the y-axis range has been reduced to reveal small-scale variations that are not visible otherwise.
- The error signal is proportional to the offset from the sun, in arcsec (50 DN ~ 1 arcsec). The plotted data is the standard deviation of the ISS error signals. The standard deviation is calculated over a running time window of 5 minutes.
- May 2011 has an increase in y-errors? November 1-10 increase? (05/22/2012)
- 201308 - The Y/Z error RMS plots need to have the range adjusted to account for the RW4 anomaly; maybe 250 for the Z? Or higher to give it some headroom? Plots are interesting, but will be more interesting with the proper range.
- 201308 - Z error went back to "normal" (20 DN) level around the time of the RW4 0 crossing; Y error does not show any sign of the 0 crossing. Expected behavior?
- Both ISS Y and Z error dropped significantly by one order of magnitude on Sep-26-2016 upon powering on the IRU heaters. (Wei Liu, 10/24/2017)
- These plots are generated by the IDL program "trend_gt_monthly.pro" when a new GT/PZT cal file is made.
- The annual variation in the PZT gains is due to the annual variation in the size of the Sun on the CCD.
- These points are taken from weekly updates to the master pointing table. (04/17/2013)
- 201308 - What's the bump in 3/2012 in the white light channel? Maybe a pinhole in the 171 entrance filter?
- 201508 - If an exposure value reaches 16,384 (2^14), that means the image is fully saturated. This will not cause any damage to the CCD, but will leave residuals that will negatively impact the next image taken. The exposure time would therefore need to be reduced. Keep in mind that the exposure time should never fall within the range of 20 - 80 milliseconds due to the way the mechanisms react to these exposure times.
- N/A
- Spike in March is due to eclipse (05/22/2012)
- Jake asked why we aren't making the plots for all of the channels. Ted Tarbell responded with:
94 and 336 don't have enough light in quiet sun to check the focus, you have to find the bright active regions and center on them. I used to do that but it was very tedious by hand. So I do the other channel in the same telescope, which is bright enough to do a full-disk mosaic of focus measurements. I assume the EUV channels in the same telescope will change focus together, if at all. 211 could be done with a full disk mosaic the same way as 193 but a little noisier since there is less light. I figured 193 was good enough to monitor that telescope. 1600 is not in the new, faster, better focus test, but I assume it will change along with 1700. (11/29/2012) - The clock tomperatures follow an annual cycle.
- The nominal daily temperature increases a bit when the spacecraft battery voltge is raised for eclipse season.
- The clock temperatures fluctuate with each eclipse during eclipse season.
- New method for plotting these soon. (05/22/2012)
- This is a plot of the Shutter Exposure Time divided by the Exposure Time Standard Deviation.
- The drop in ATA 4 (304 and 94 channels) corresponds to the ATA 4 telescope bakeout.
- The quality has increased over the mission in nearly every channel, possibly thanks to general "wear-in".
- Seeing a strange pattern in the 211 channel; scaling issue? (02/21/12)
- 304 seems to have flattened. (05/22/2012)
- AIA Readout Errors (IMC220) Instrument Anomaly Report (IAR) #17: Occur during times of high solar activity. Commanded Exposure time occasionally reaches as high as 40 ms during times of high activity during the Automatic Exposure Control operation. Nominal exposures are below 30 ms and the increased exposure time interferes with readout timing. Example ANS message received is, IMC220 20:29:05 EIP: ssim_tm: IMC220 Readout timer has expired, but shutter has not closed. See also https://hmi.lmsal.com/IAR/vcur/SDOIAR0017
- AIA Frame Errors (ISQ203) Instrument Anomaly Report (IAR) #15: Most occurrences were when resetting parameters on return to the nominal frame list from off point maneuvers or other calibrations. A large number were generated 22/23-May-2012 during testing of sequences for the Venus Transit. Other instances were following EVE Cruciform maneuvers, Lunar Transits, and testing of the Long Exposure Calibration frame list. Example ANS message received is, ANS message: 11-139-16:06:44.003 TLMH-I:SC AIA :ISQ203 14950 Frame 3 from framelist 3043 had error BUSY_TS1 | Pkt Count= 6635. See also https://hmi.lmsal.com/IAR/vcur/SDOIAR0015
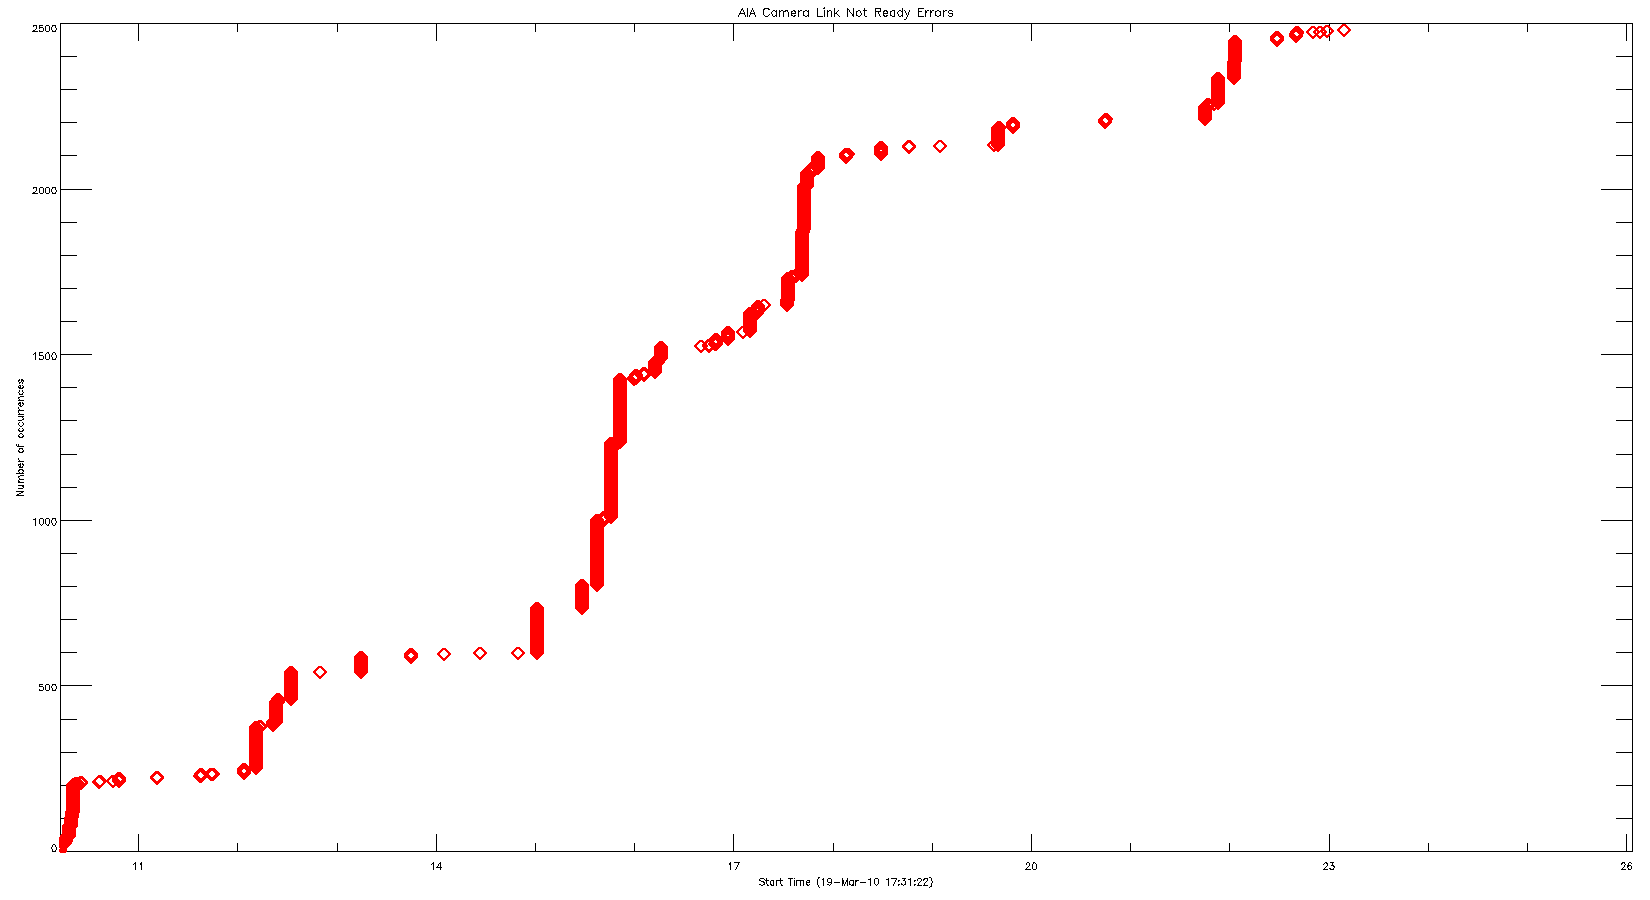
- AIA Camera Link Not Ready Errors (IMC216) No IAR assigned: Occur during times of high solar activity. Additional bright pixels from high energy particle hits to the CCDs decrease data compression efficiency. From J. Schou: -they are due to the images not compressing well, which in turn leads to telemetry oversubscription and thus dropped images; so, the transmission does not happen in time before a later image shows up. Example ANS message received is: ANS message: 15-009-09:02:55.698 TLMH-I:SC AIA :IMC216 53439 TS4: Frame 102402954[3]: CLR CAMERA_LINK_NOT_READY TS[0 0 0 0 0] ISP=T TD=1.64 | Pkt Count= 4997
Trending Review Meeting Notes
CCD Temperatures
Top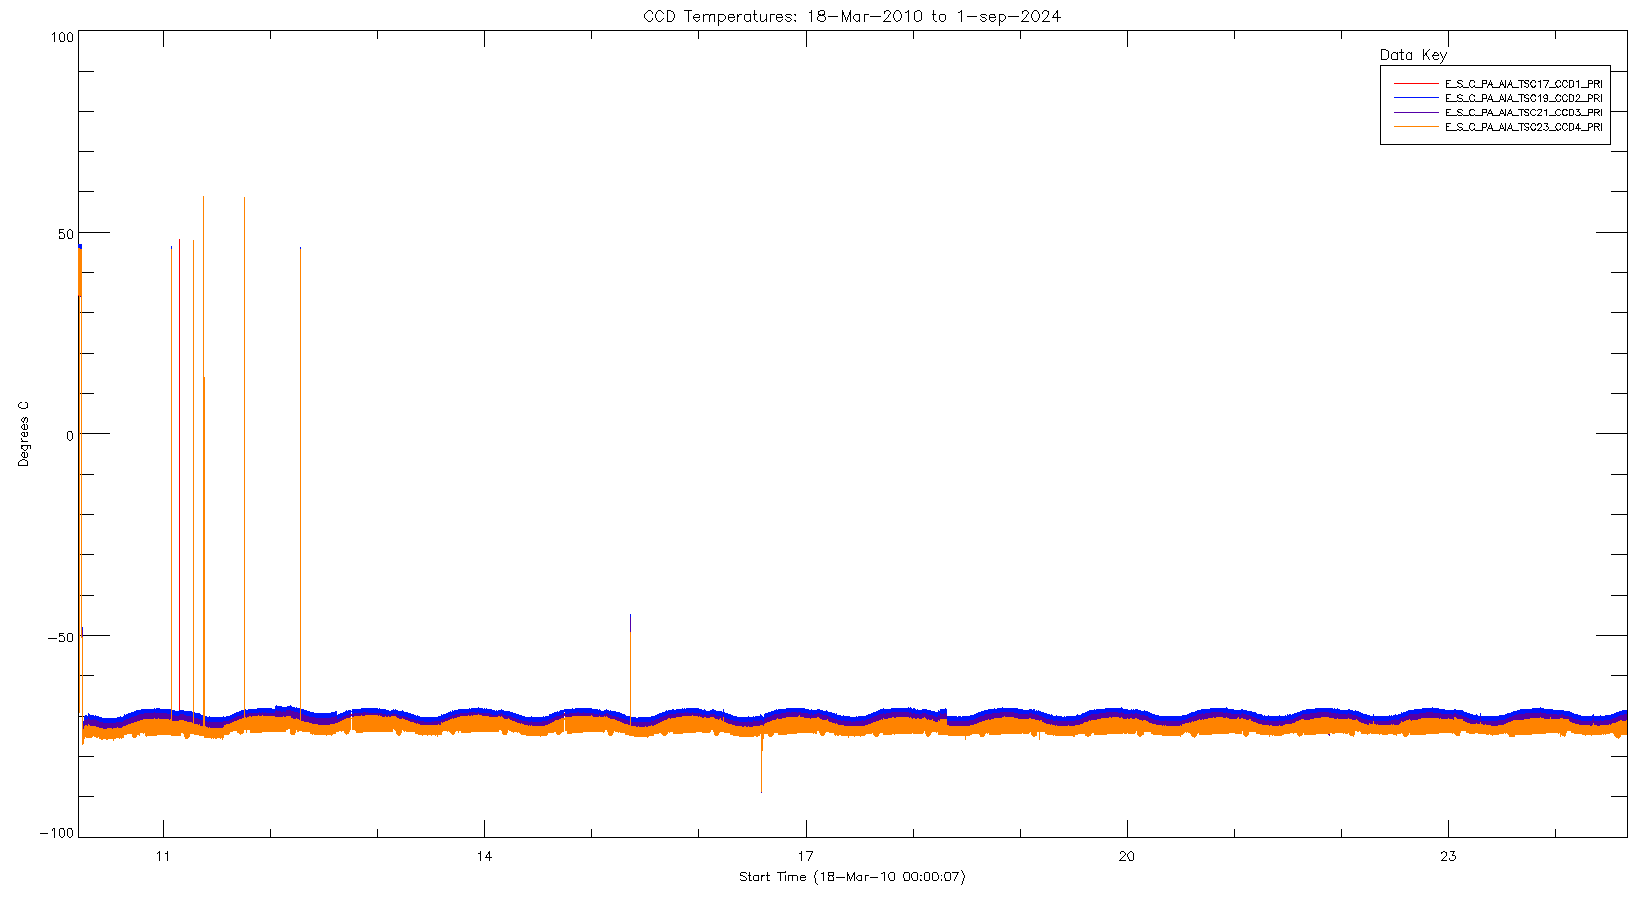
Focal Plane Assembly Temperatures
Top
HOPA Temperatures
Top
Spider and Secondary Mirror Temperatures
Top
AEB Temperatures
Top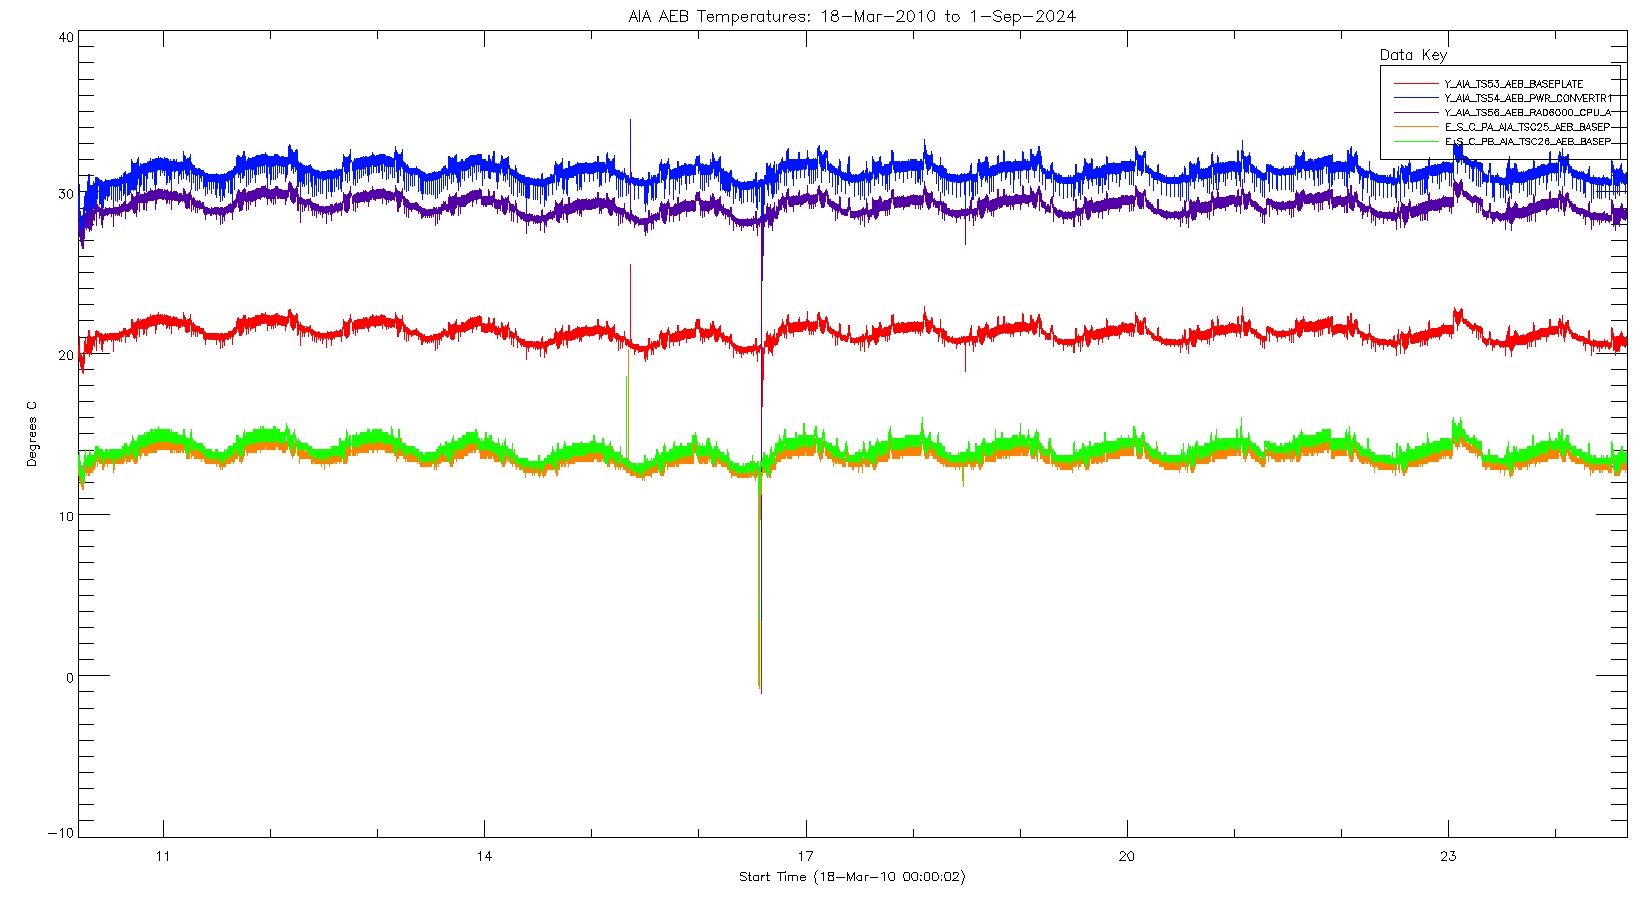
CEB Temperatures
Top
Aft Temperatures
Top
Forward Temperatures
Top
Front Aperture Assembly Temperatures
Top
GT Temperatures
Top
Spacecraft Bus Voltage
Top
Bus Current
Top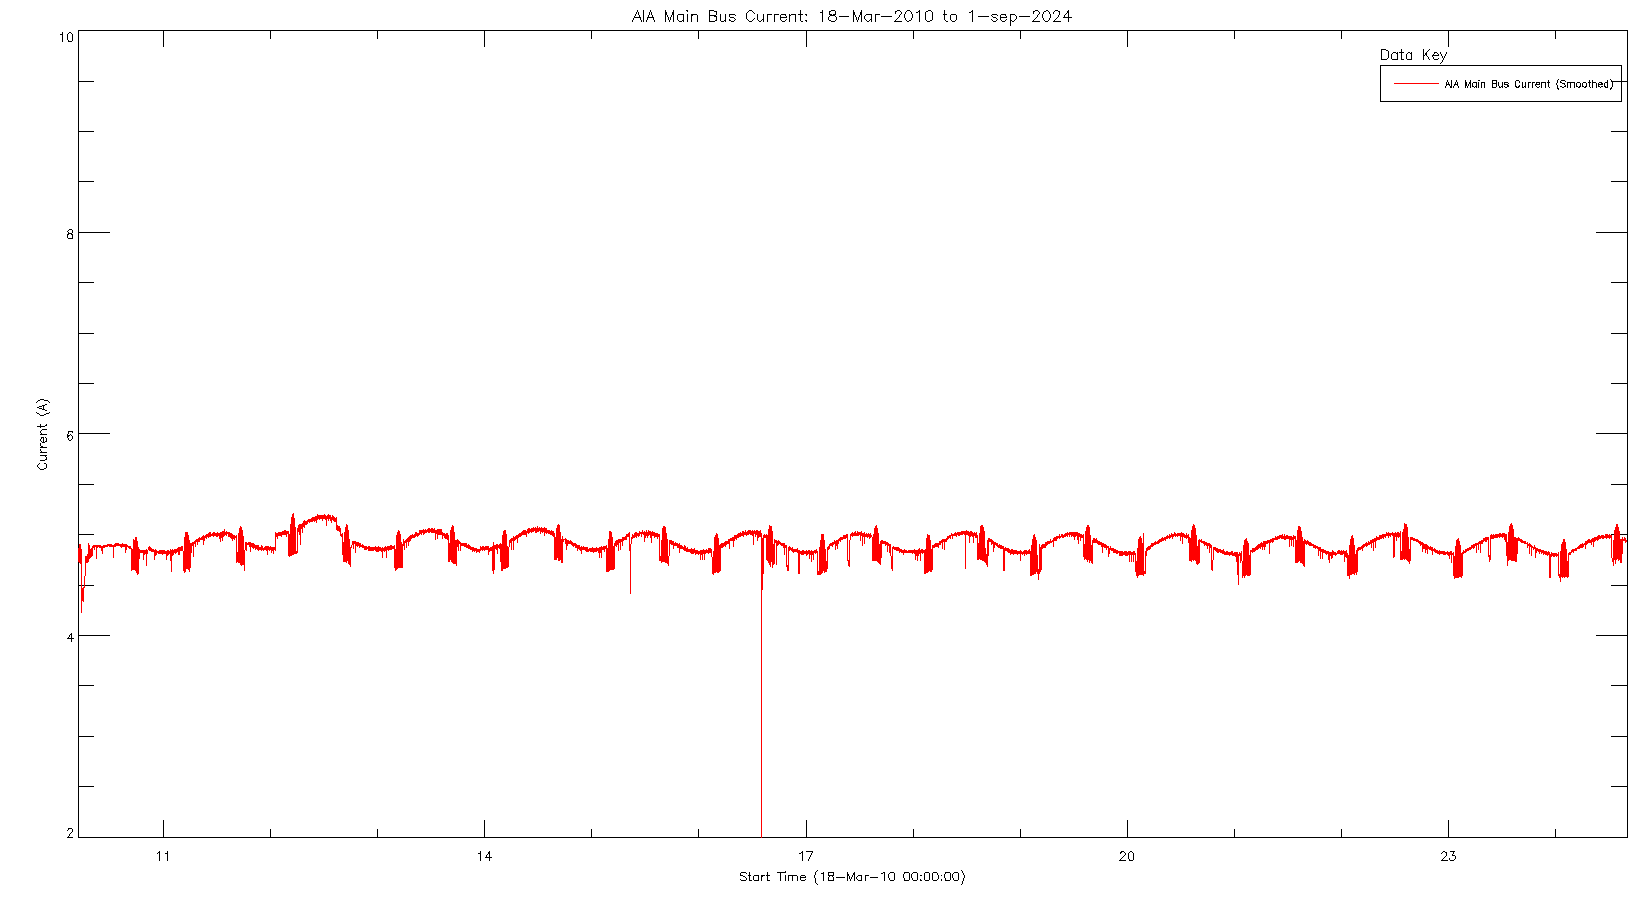
Motor Currents
Top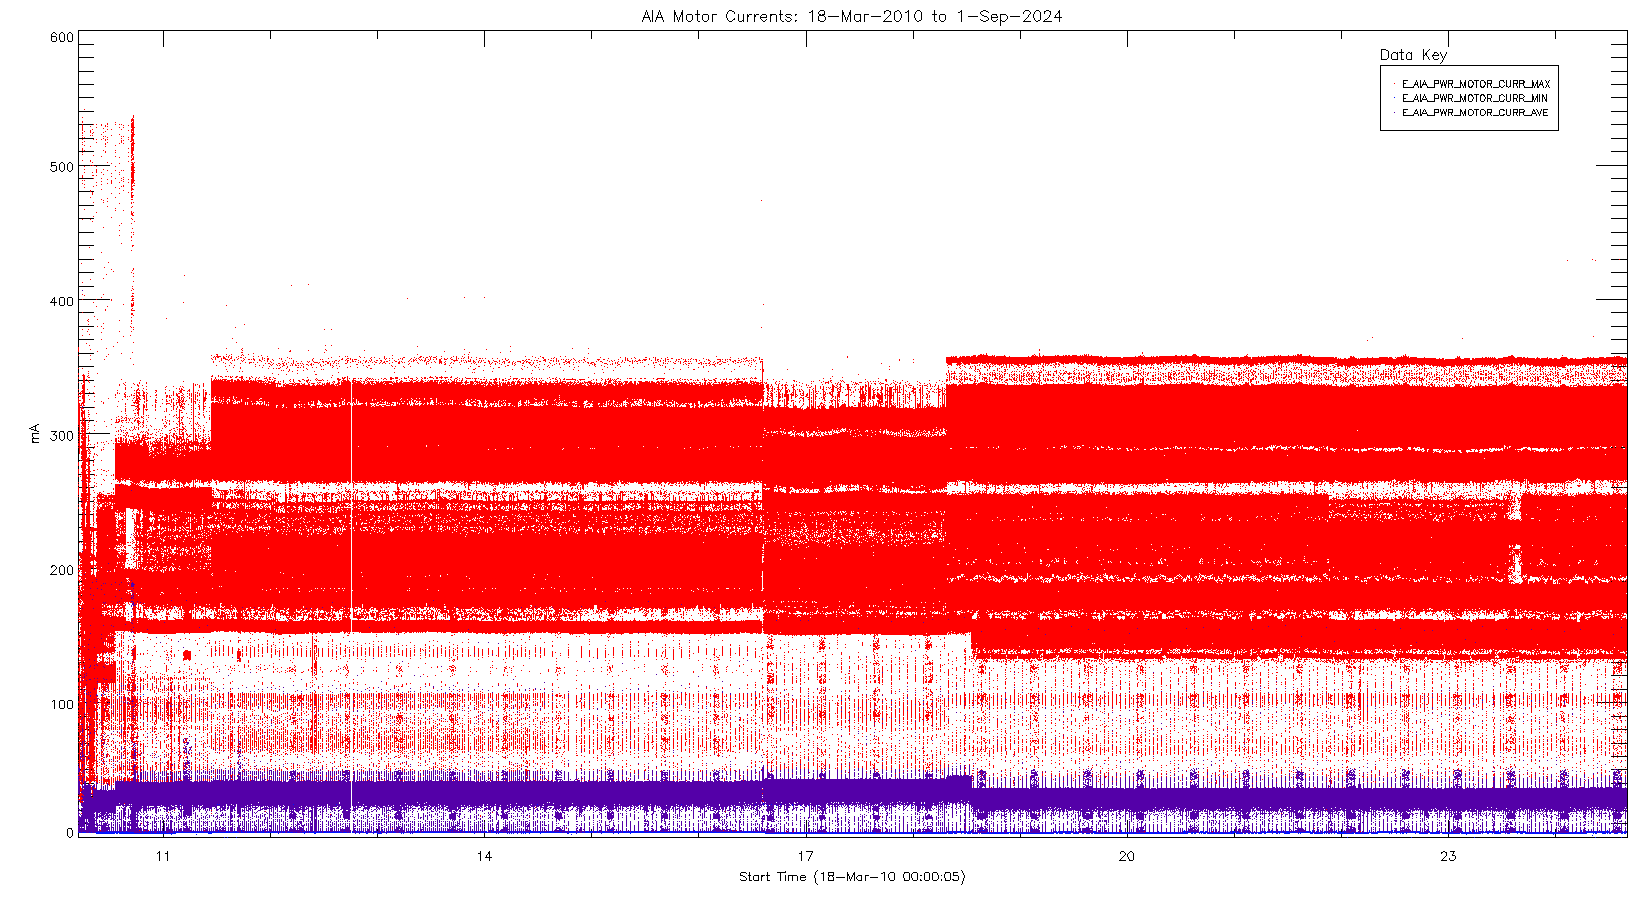
Secondary Voltages (3 & 5 V)
Top
Secondary Voltages (15 & -15 V)
Top
Secondary Voltages (78 V)
Top
ISS Diode Voltages
Top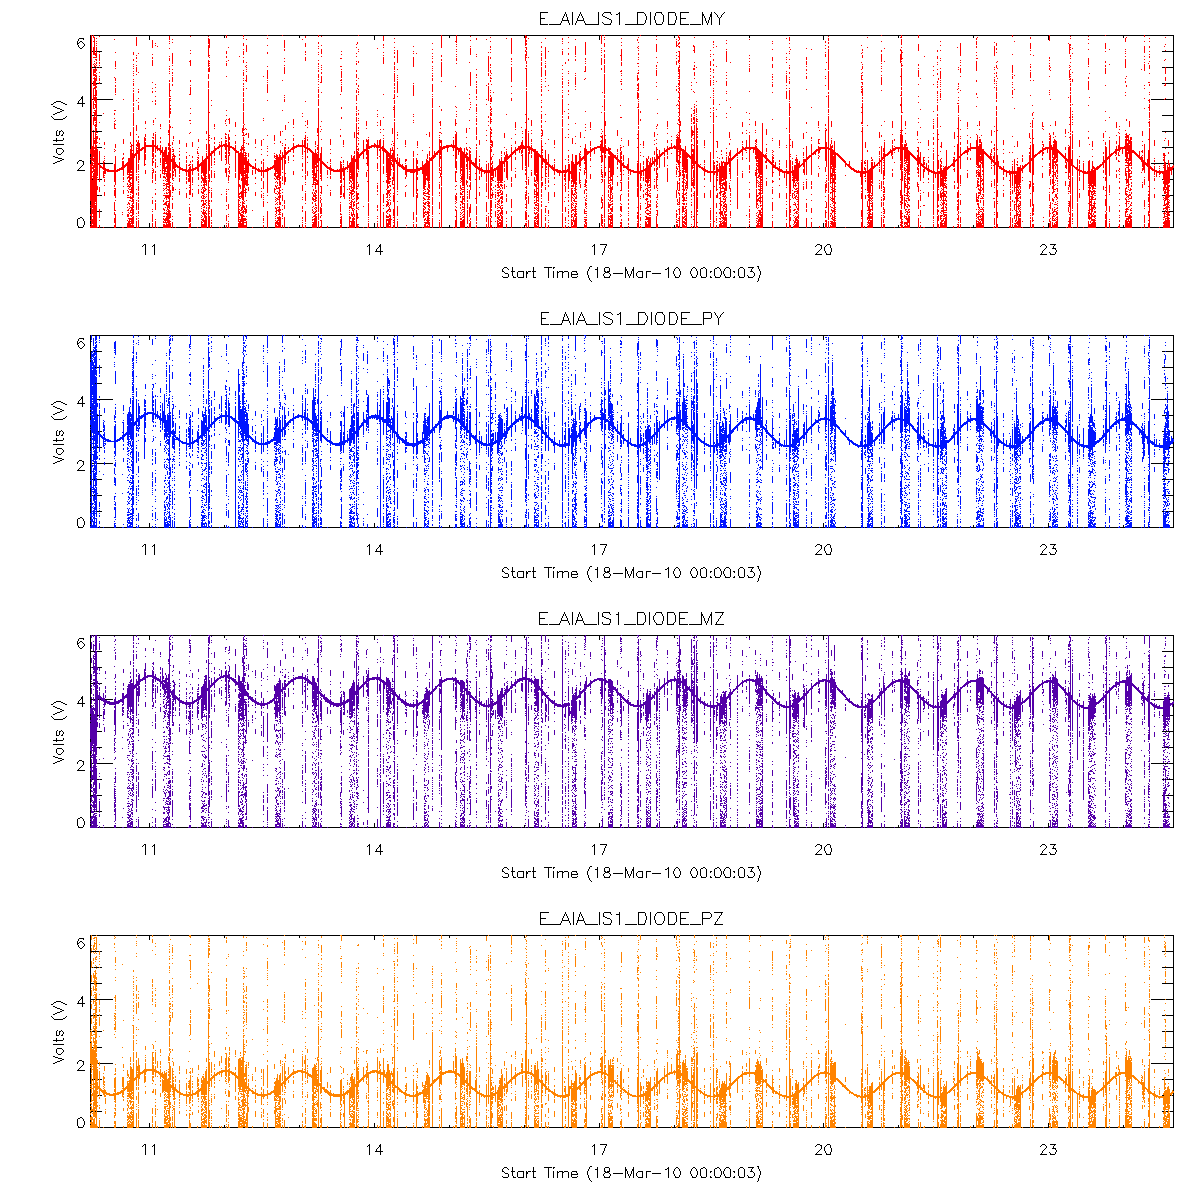
Aperture Selector Move Times
Top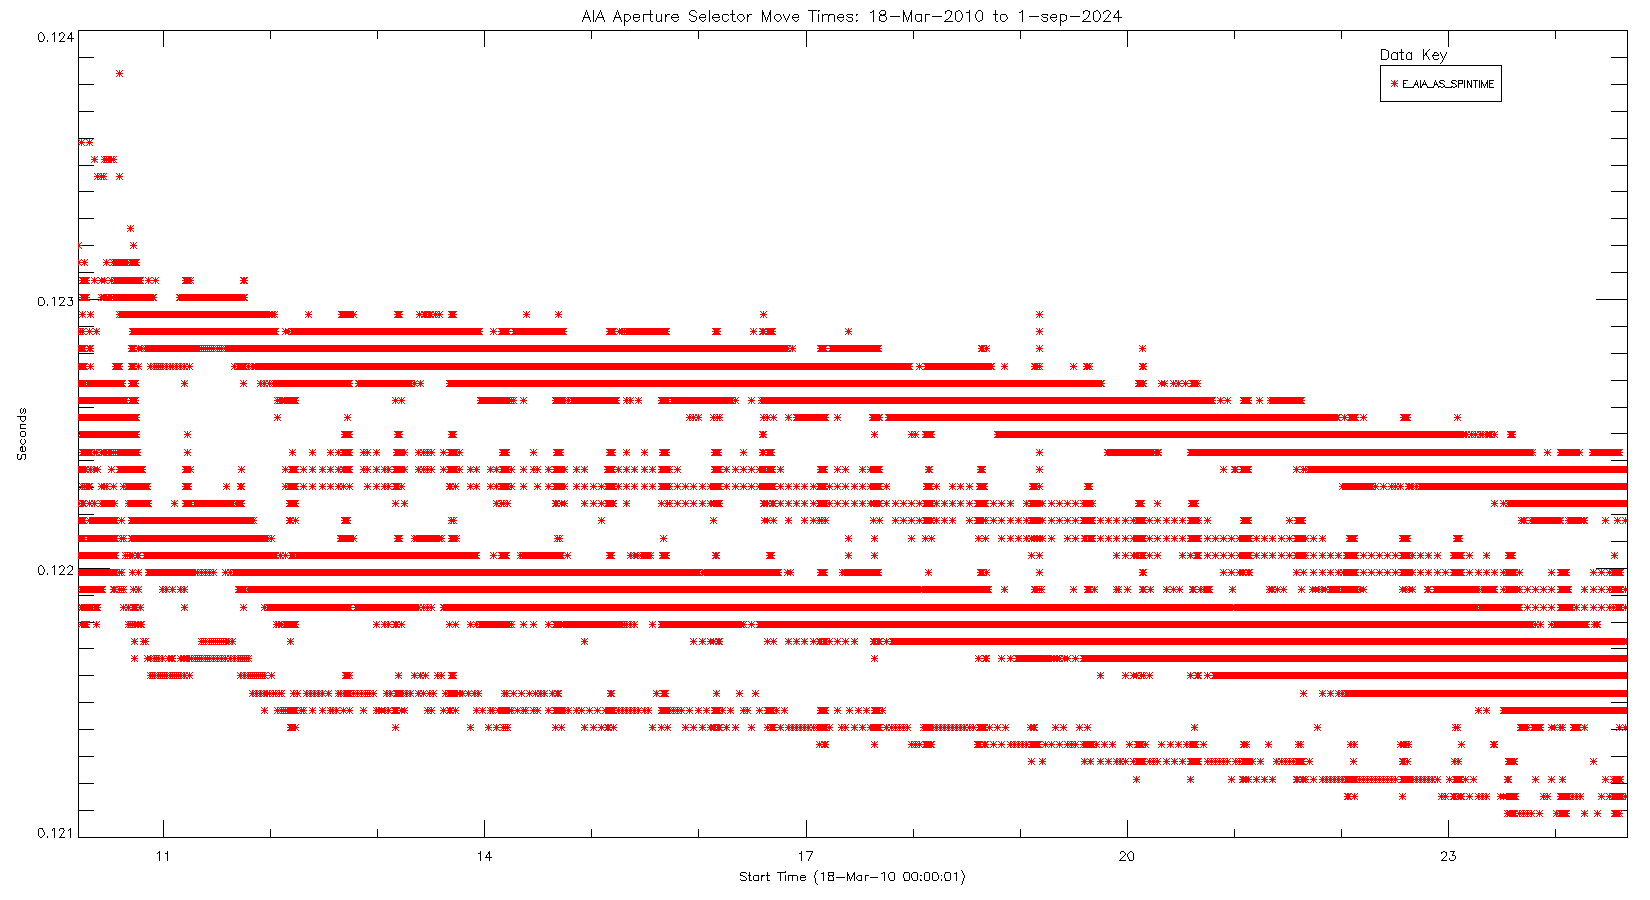
The plot shows three "tiers" of times.
Filter Wheel Move Times
Top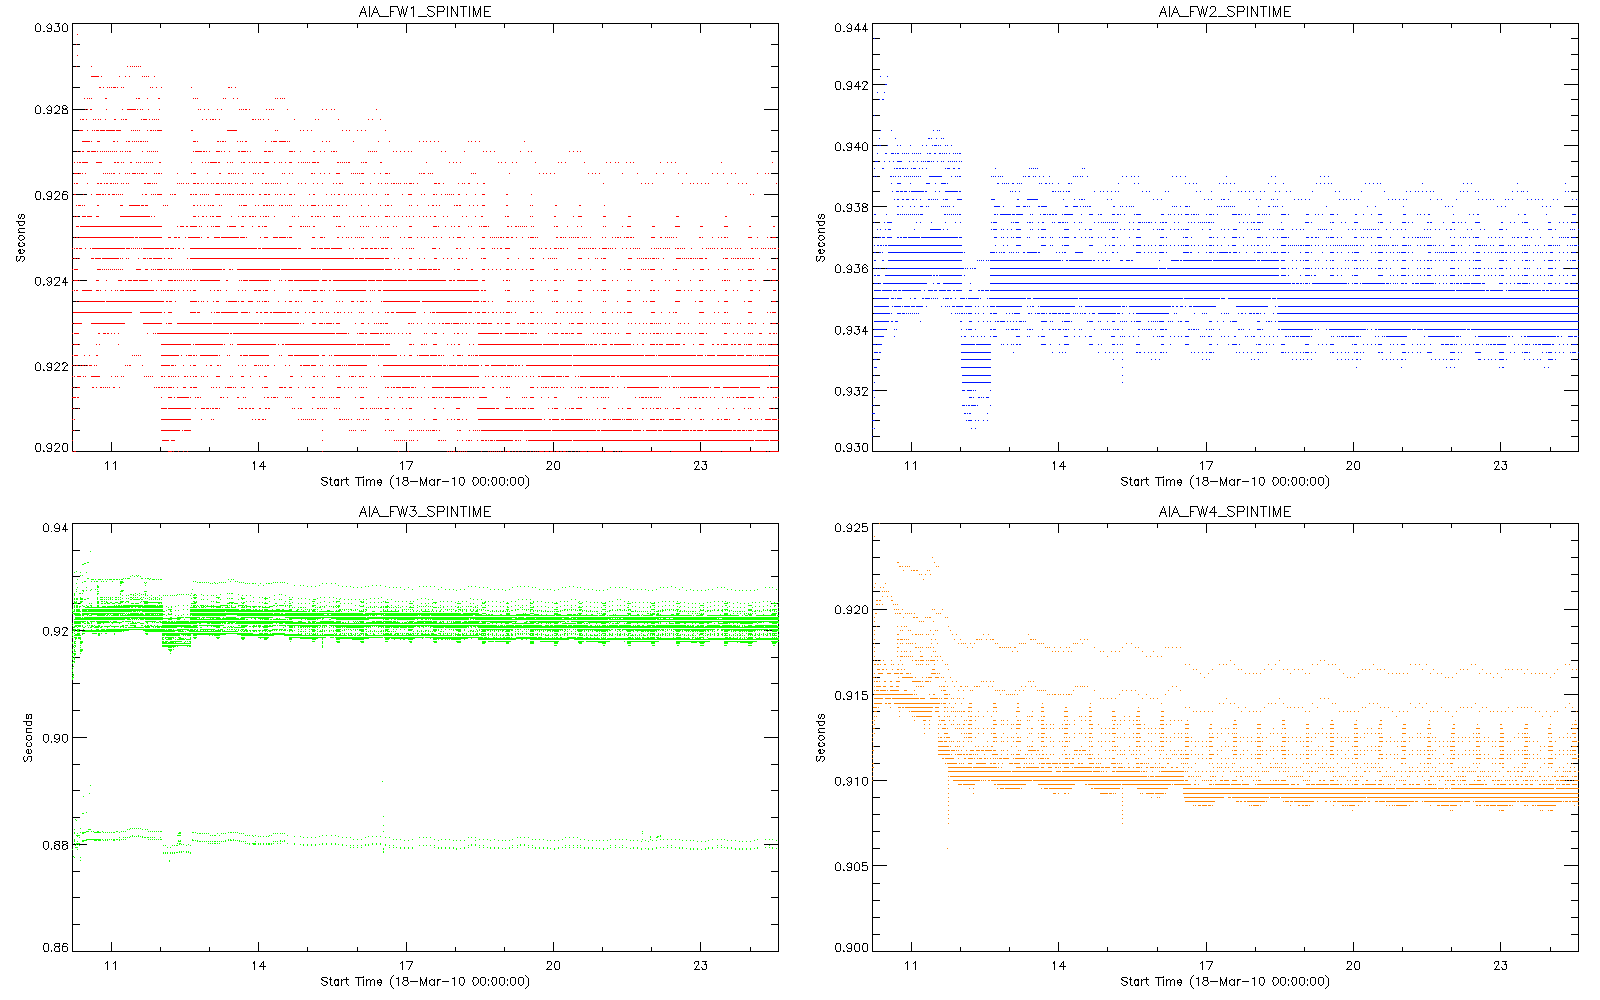
Shutter Open Times
Top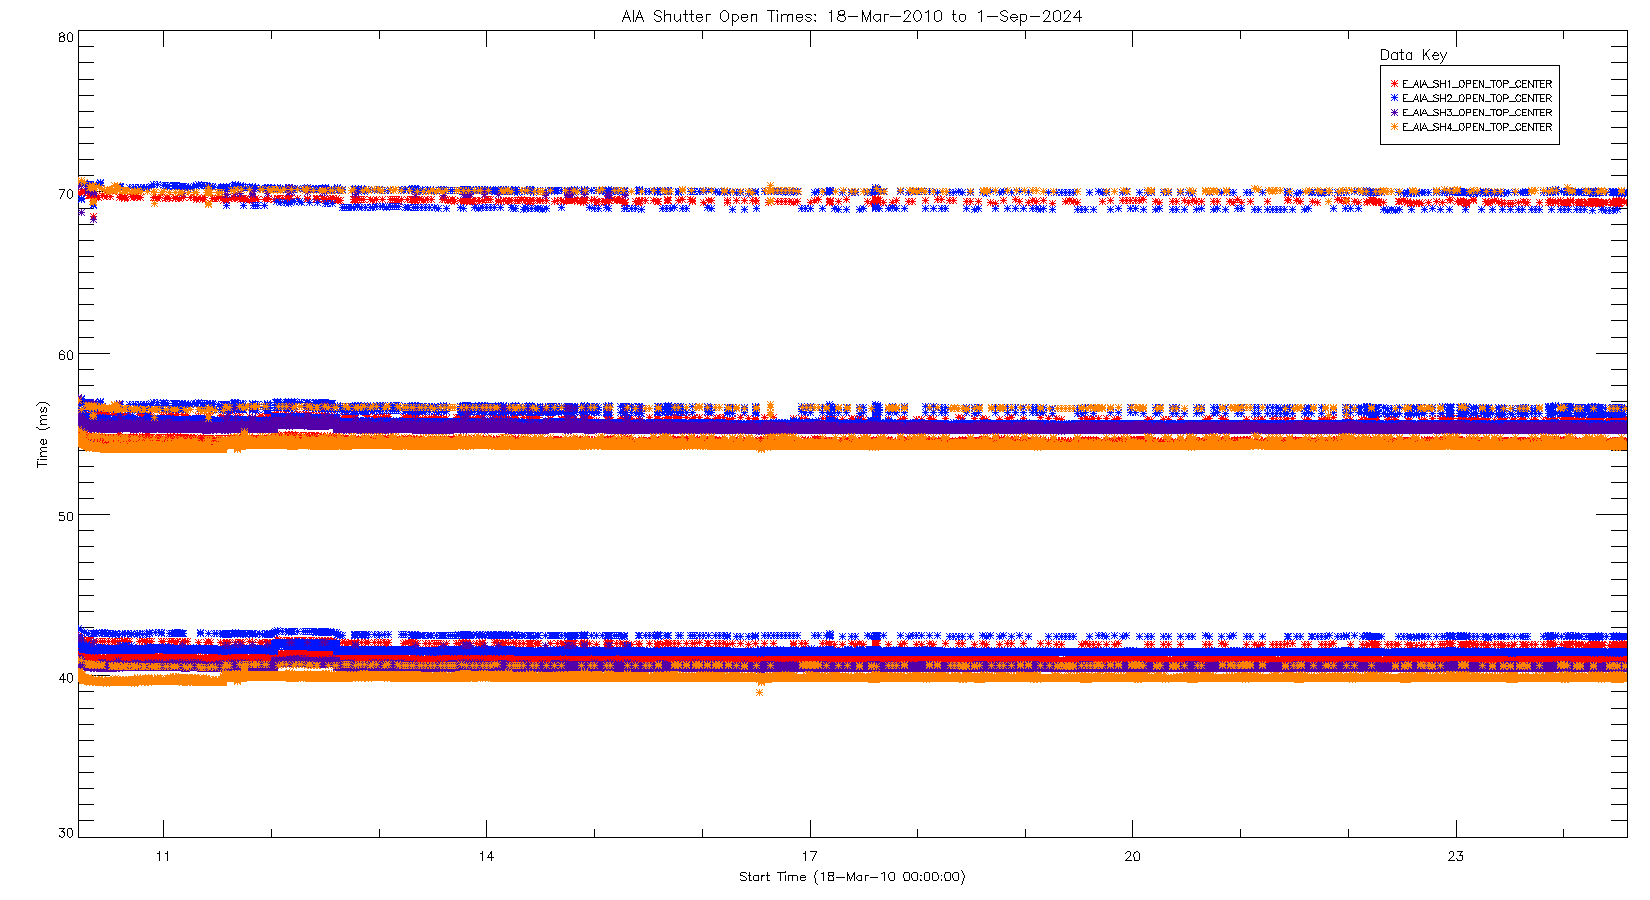
Shutter Error
Top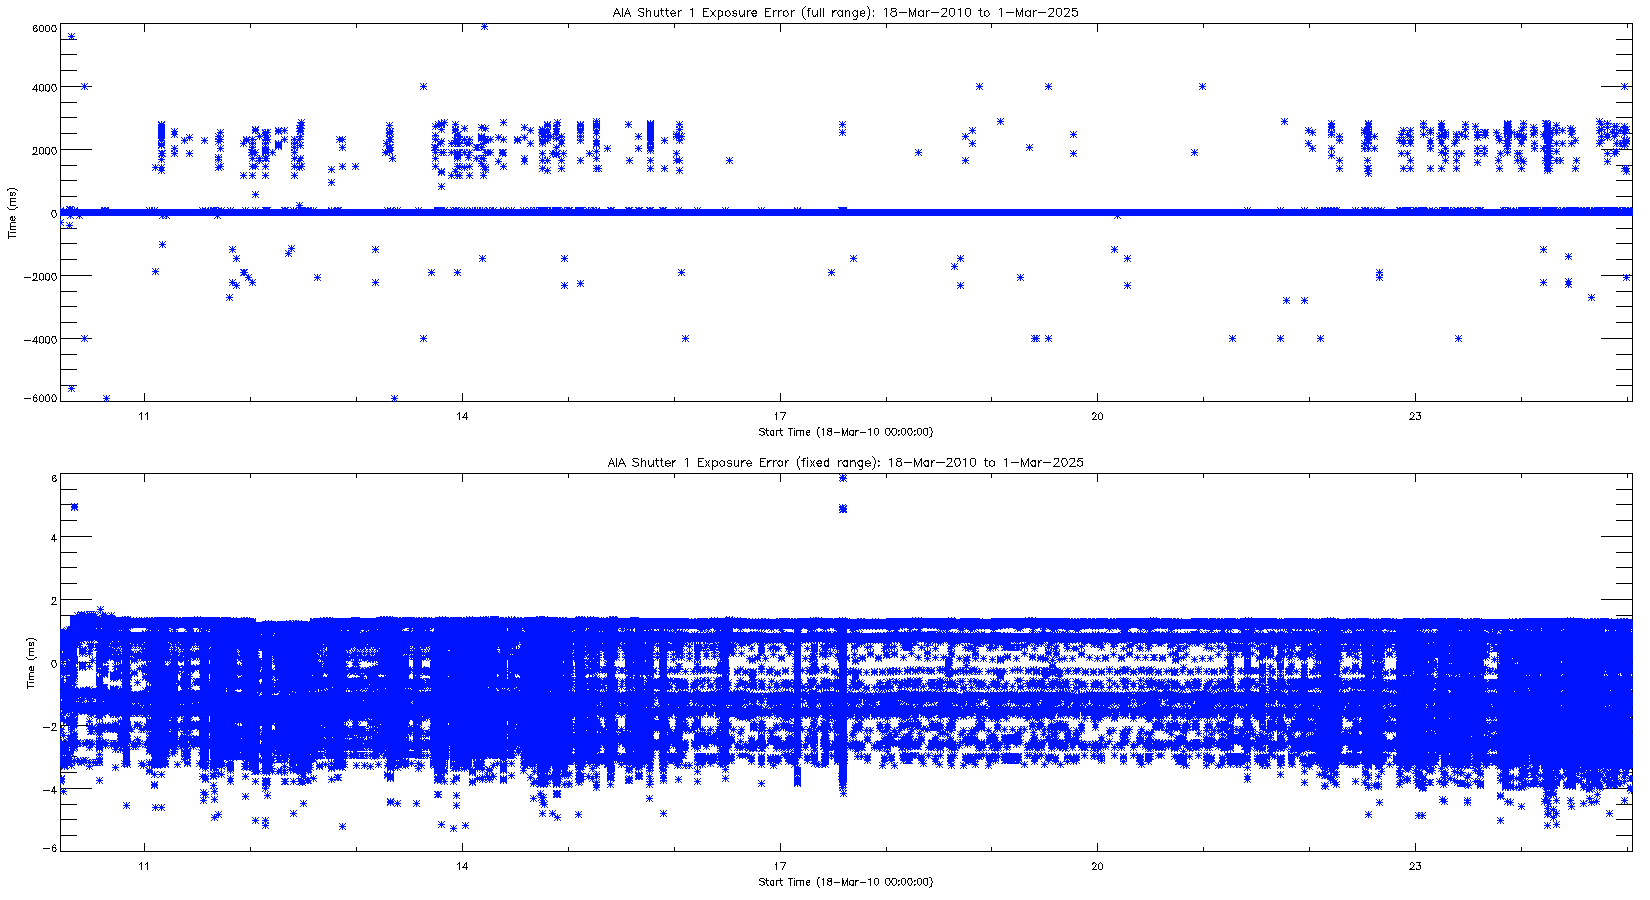
Shutter Exposure Time (Deprecated)
Top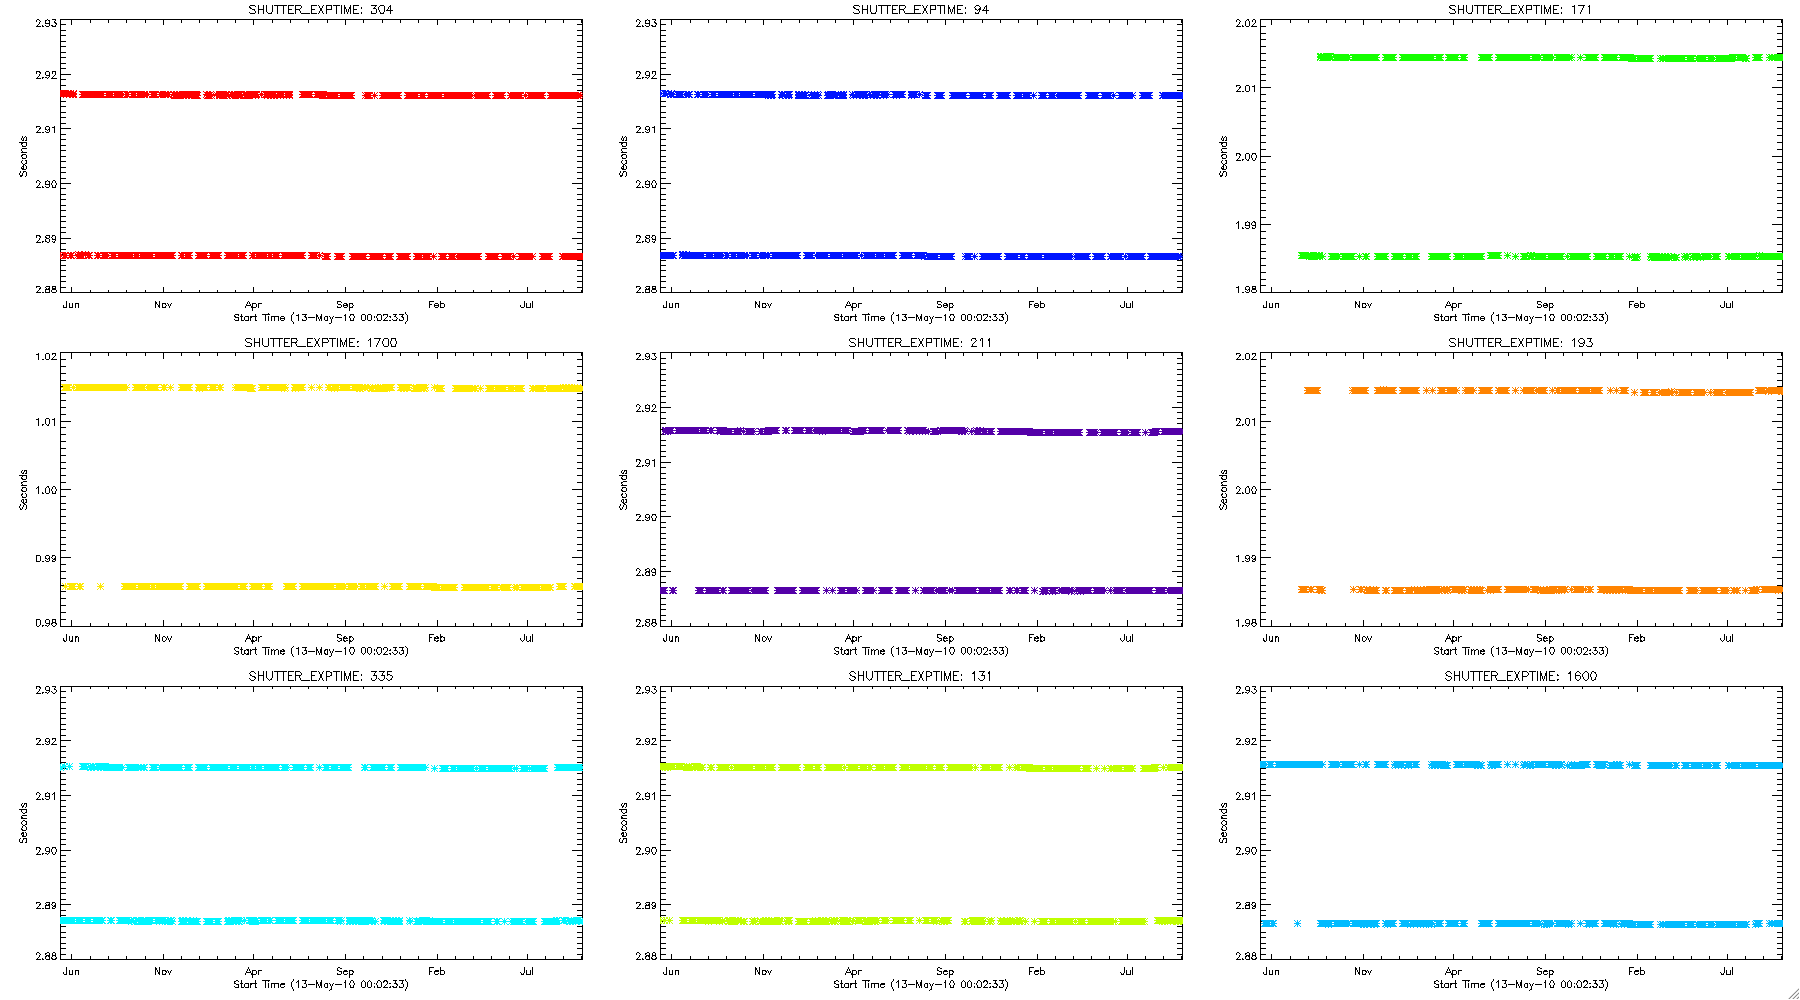
AIA-EVE Plot ratio
Top
From AIA03821 "Memo on Sensitivity Loss in AIA 304" By Paul Boerner:
The plot with all wavelengths shows the comparison between AIA full-disk count rates observed in each of the AIA EUV channels and the count rate that is predicted based on EVE observations folded through the AIA wavelength response functions. A ratio of 1 indicates that the AIA calibration and the EVE calibration are in perfect agreement. Ratios greater than 1 imply that the AIA sensitivity is greater than what is predicted based on the AIA wavelength response functions (or that EVE’s sensitivity is less than what the EVE team believes it is).
A few notes on the data processing:
Camera Gain Settings
Top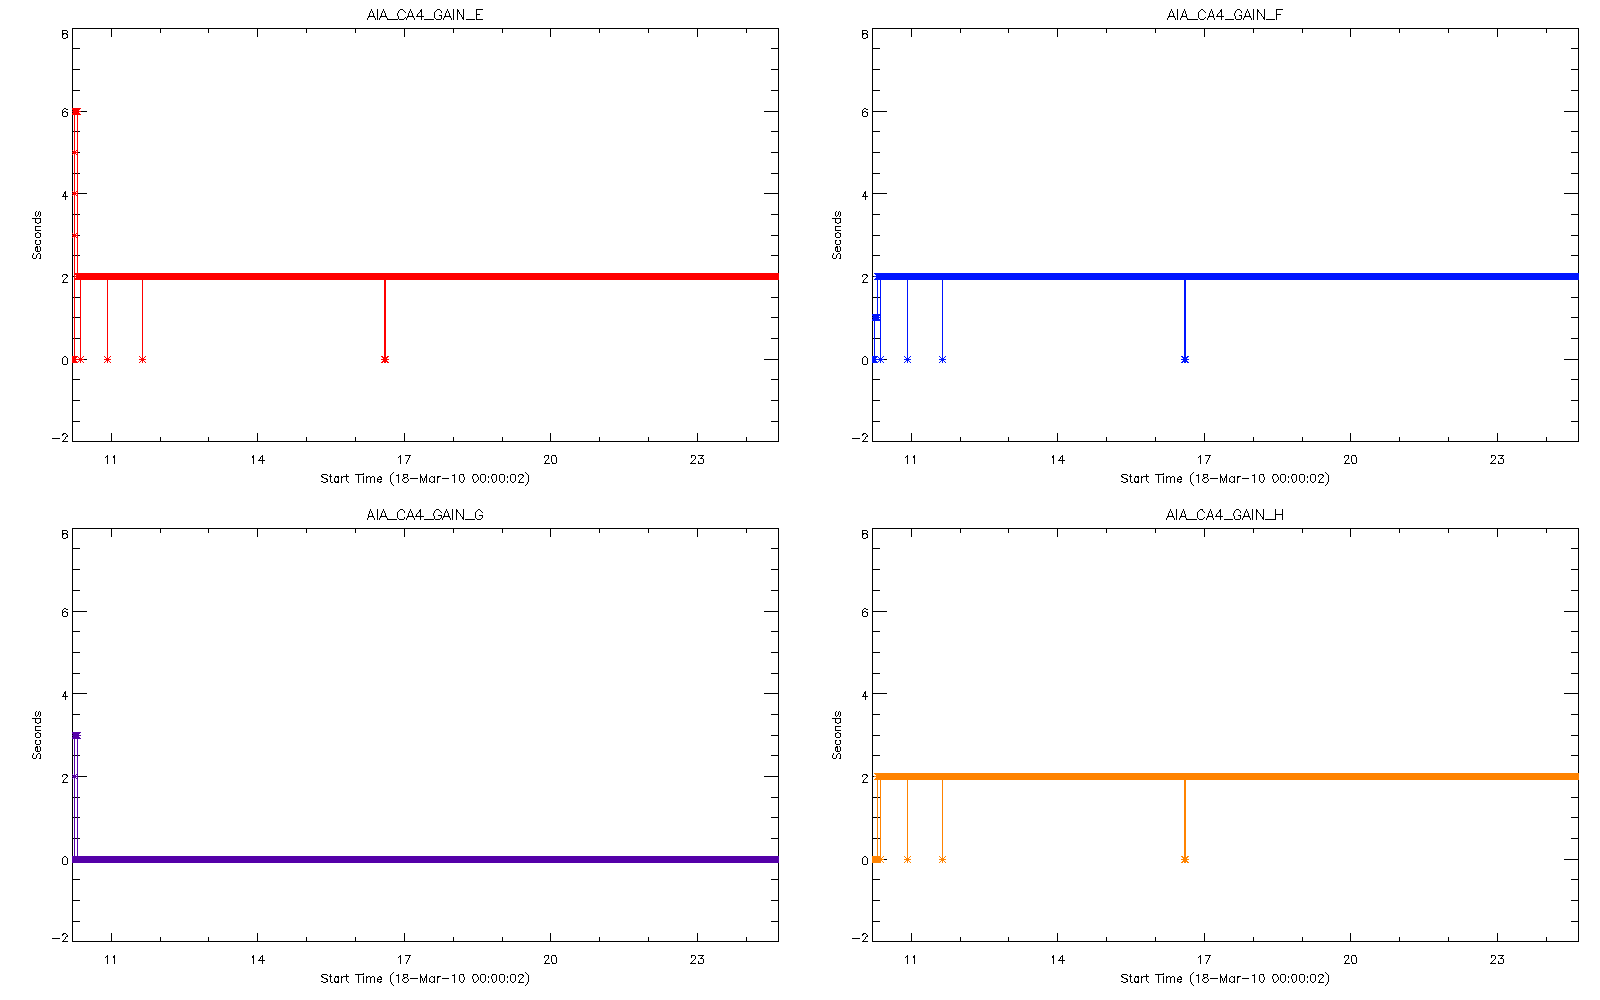
Dark Currents
Top
NPACKETS
Top
NSPIKES
Top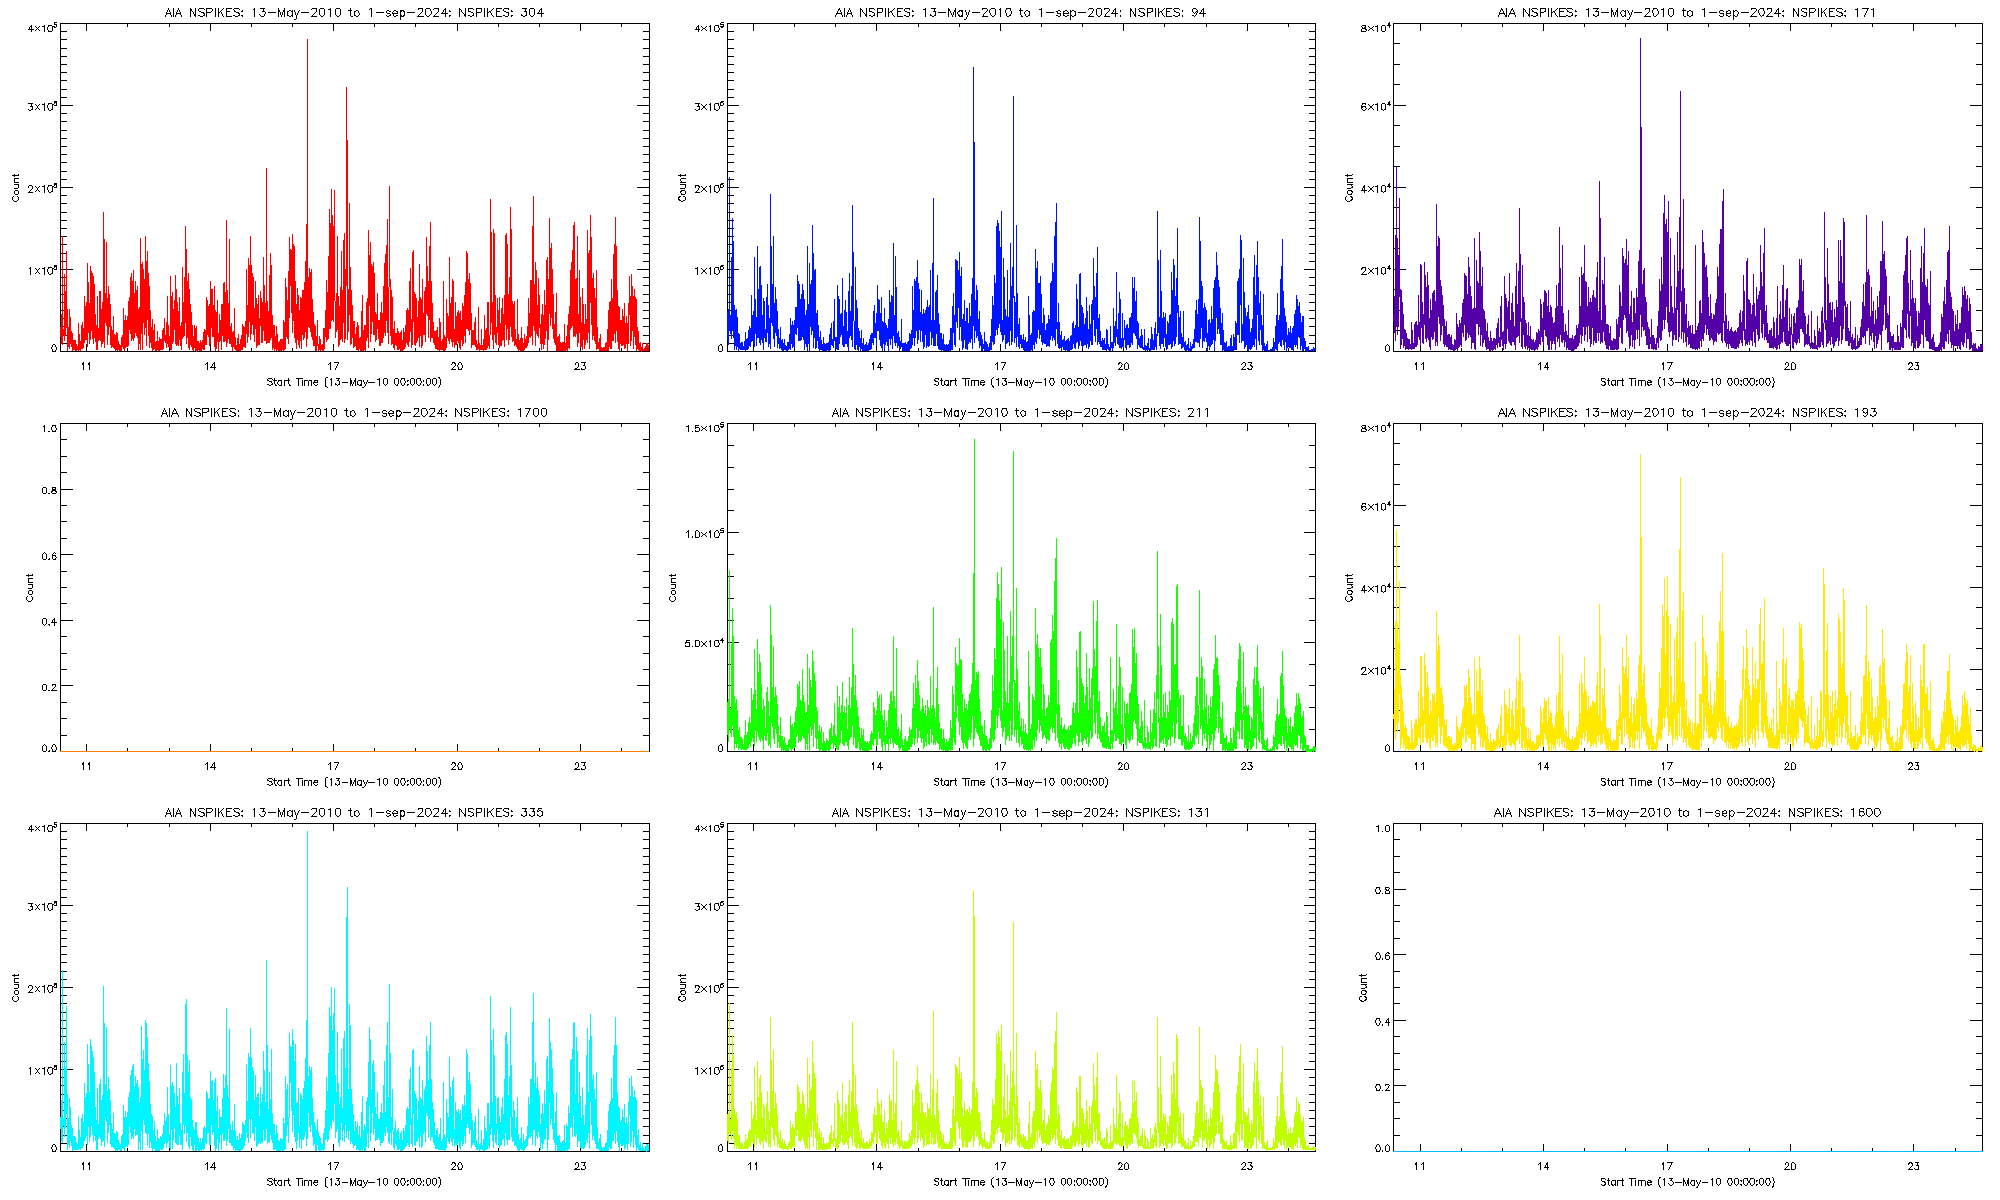
DATAMIN
Top
Mean Pixel Value
Top
Camera Offset Settings
Top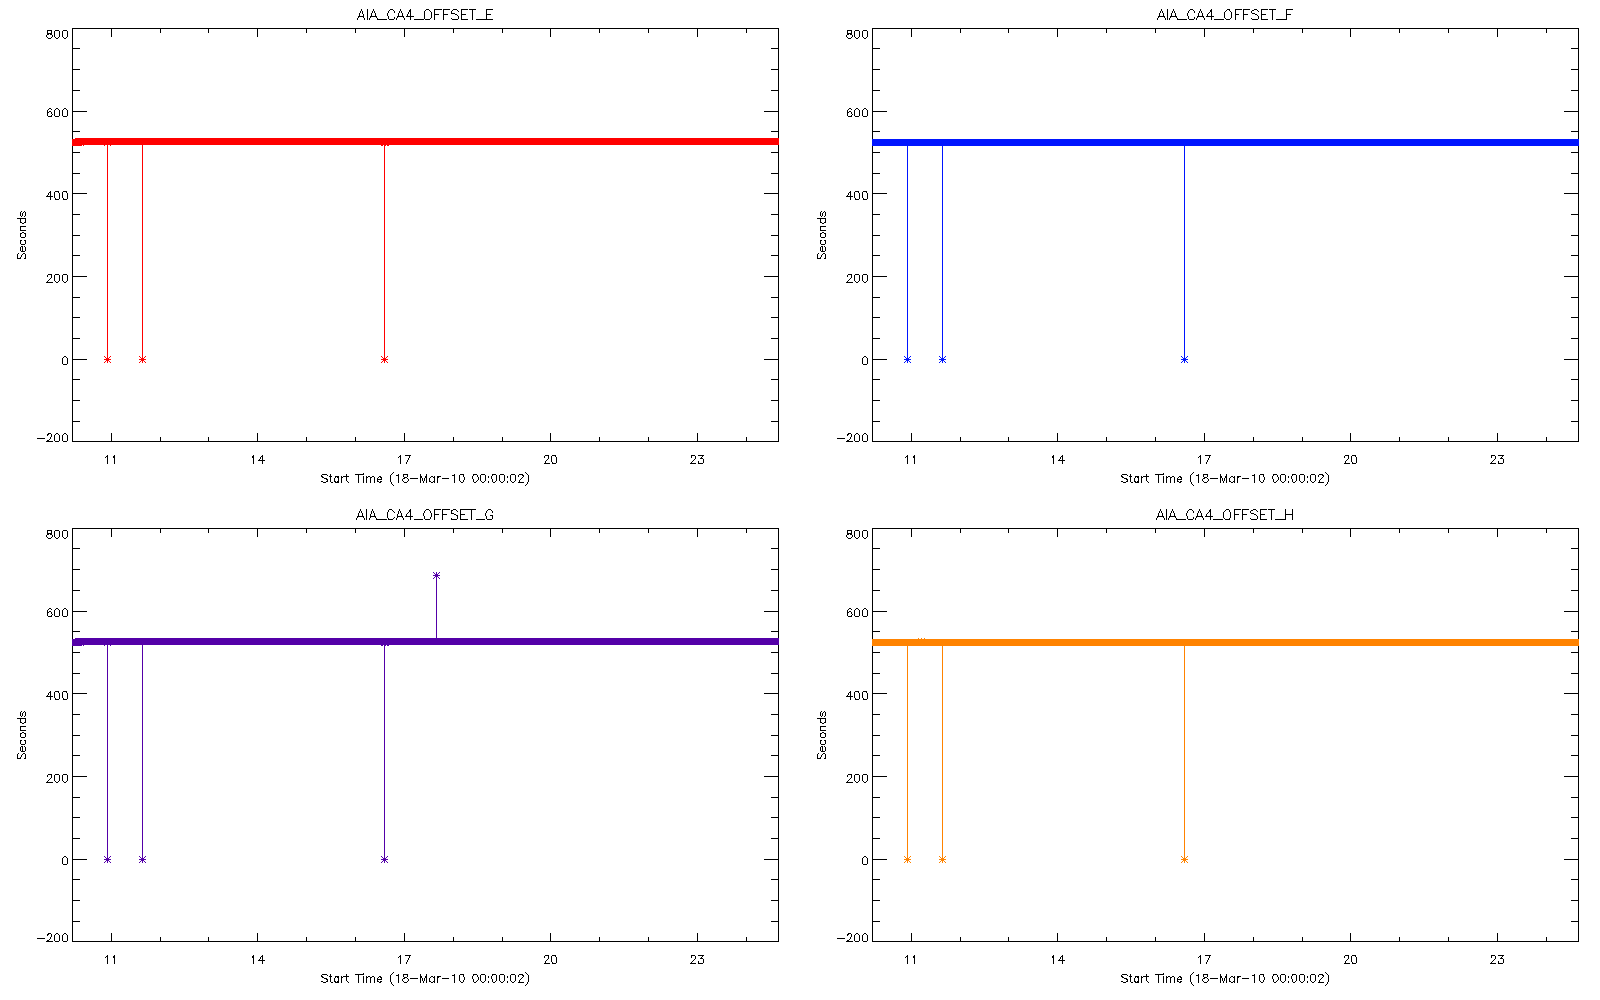
Clock Increment
Top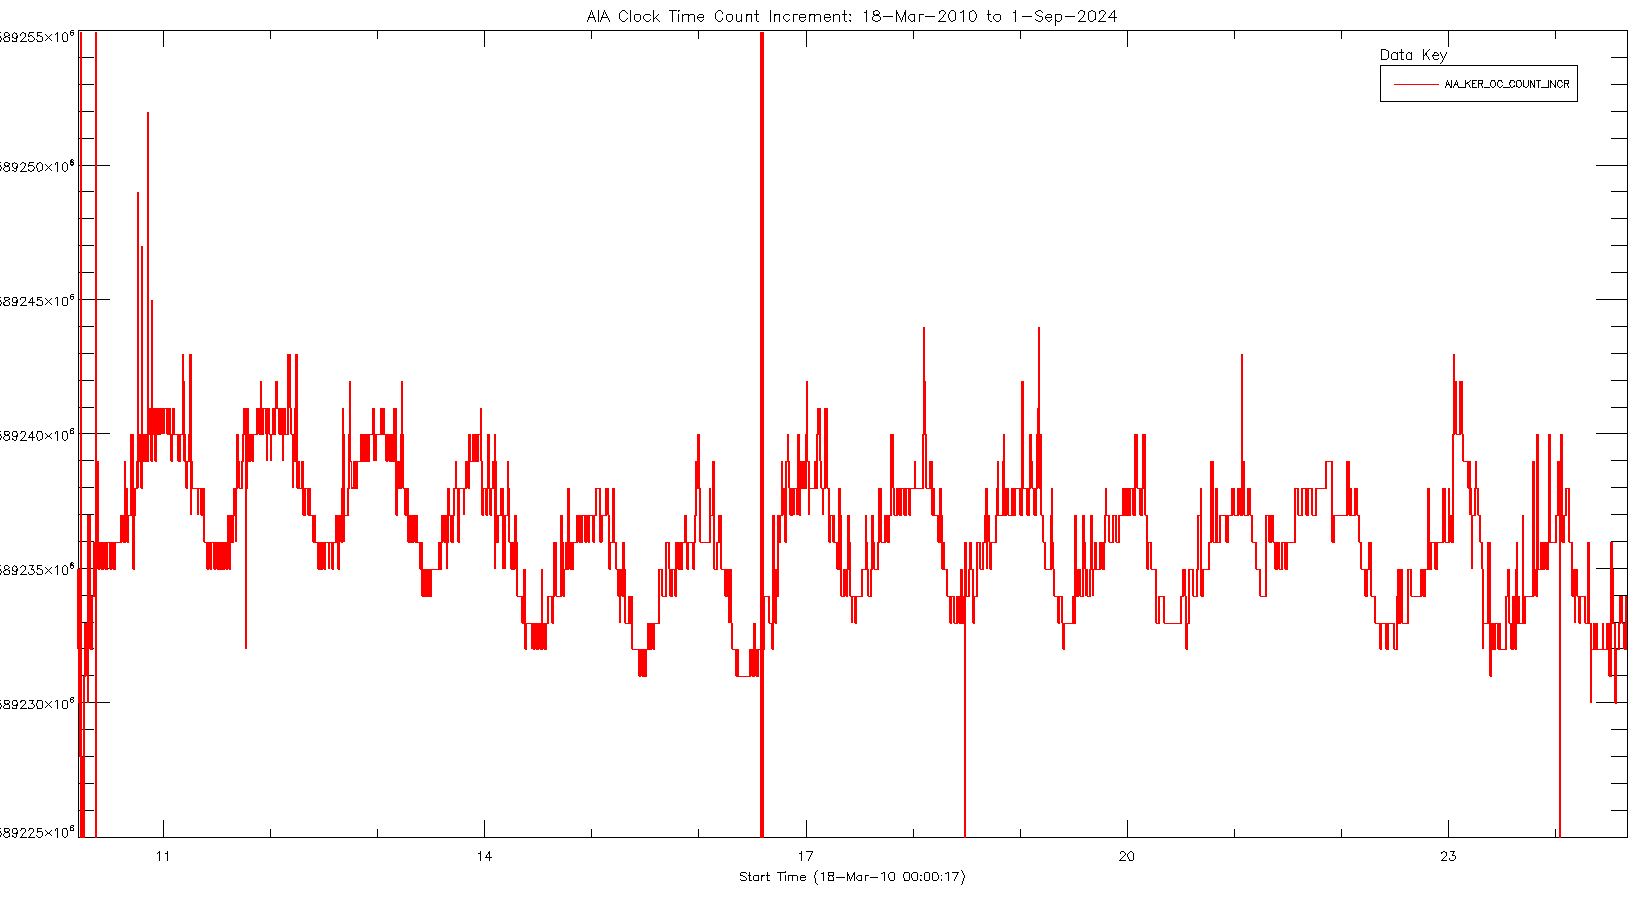
ISS Error
Top

PZT Gains
Top
Telescope Pointing
Top
Filter Health
Top
Filter Ratios
Top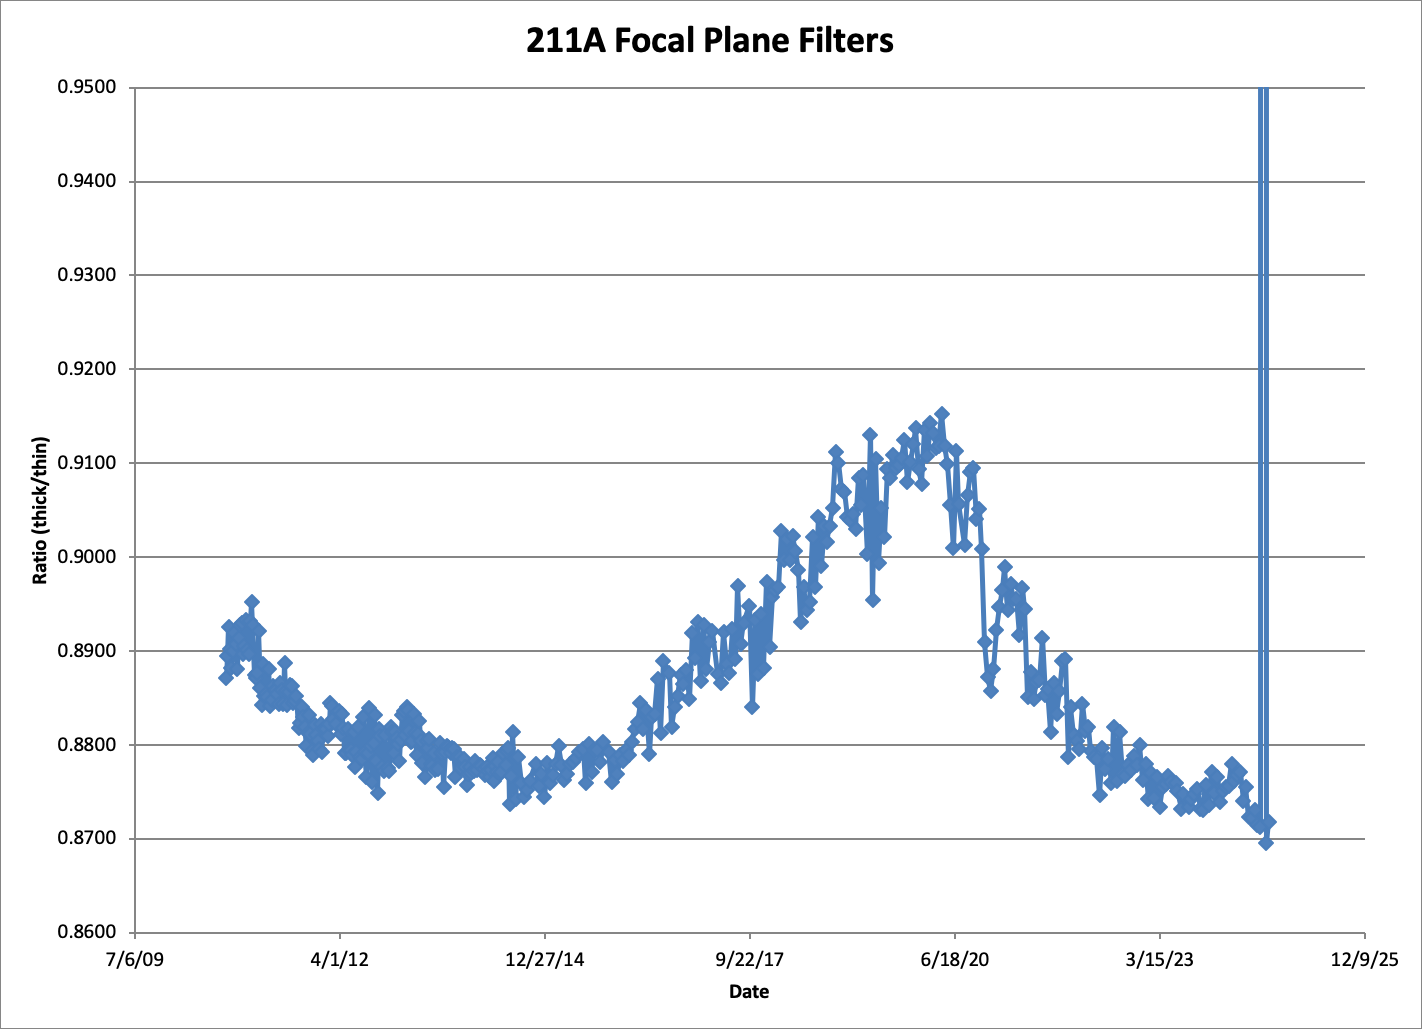
Focus
Top
Clock Temperatures
Top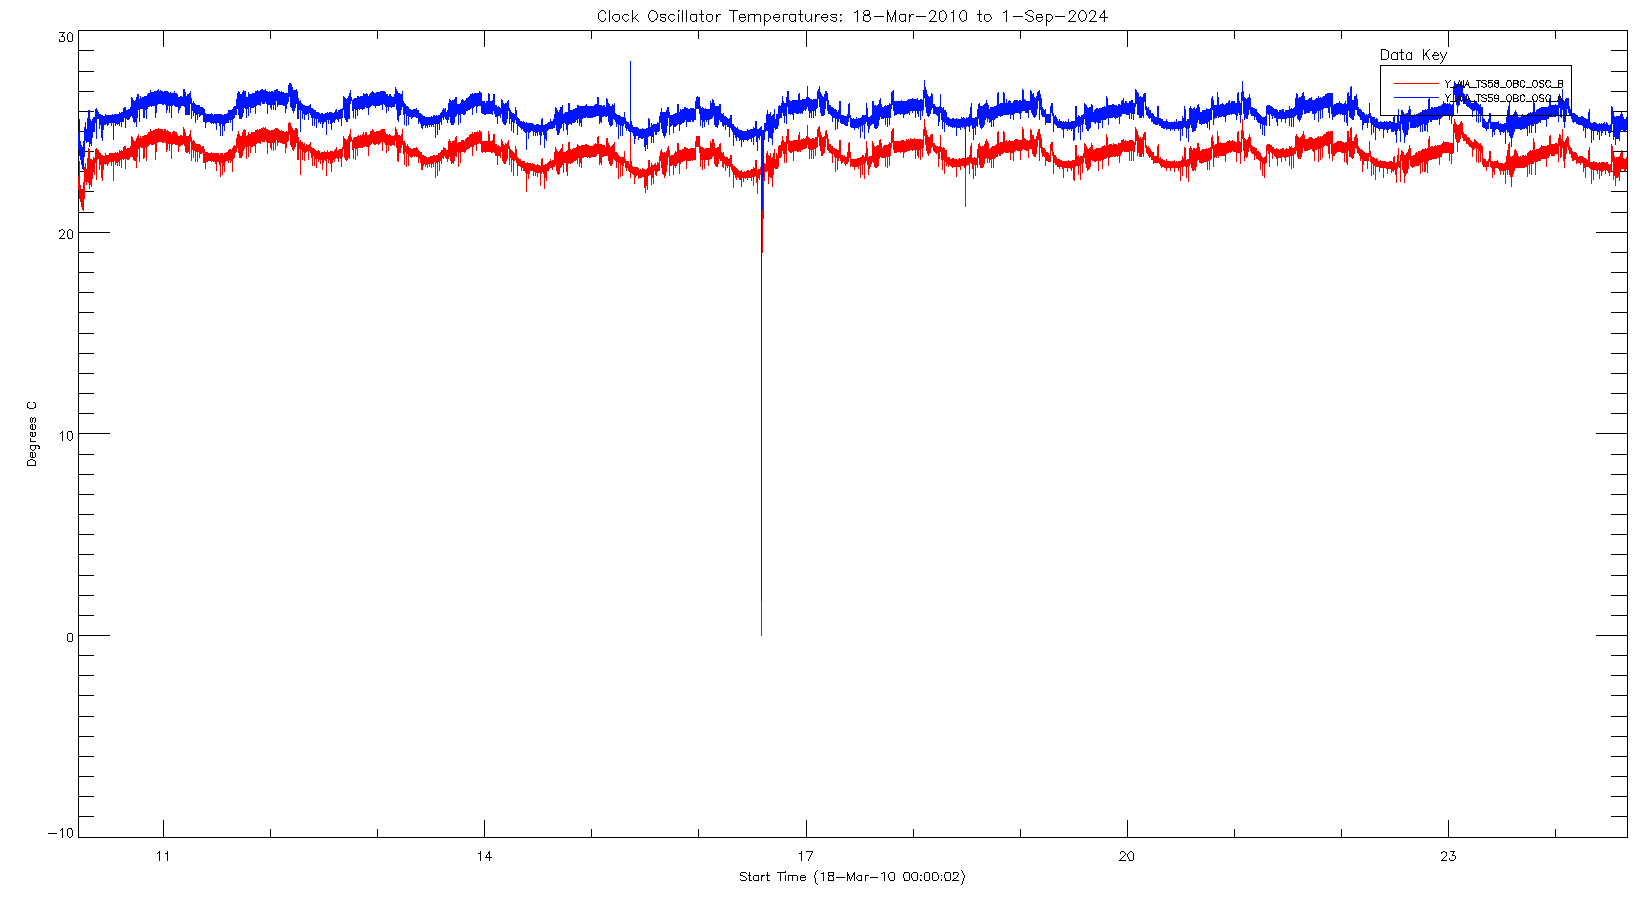
Corrupt Images
Top
Exposure Quality
Top
AIA Readout Errors
Top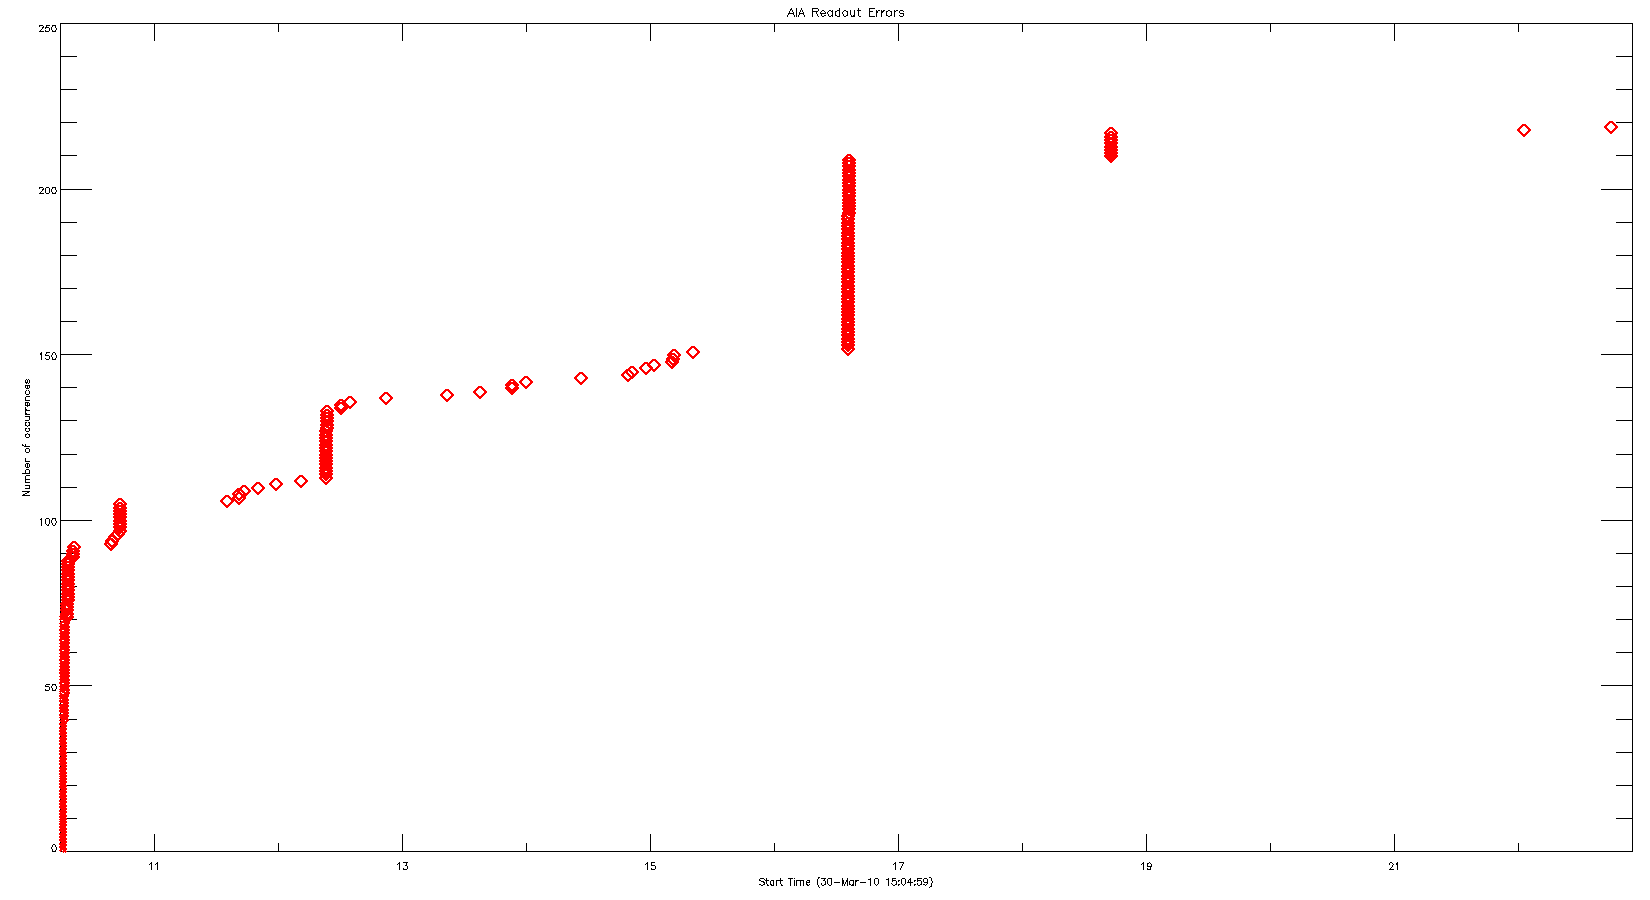
AIA Frame Errors
Top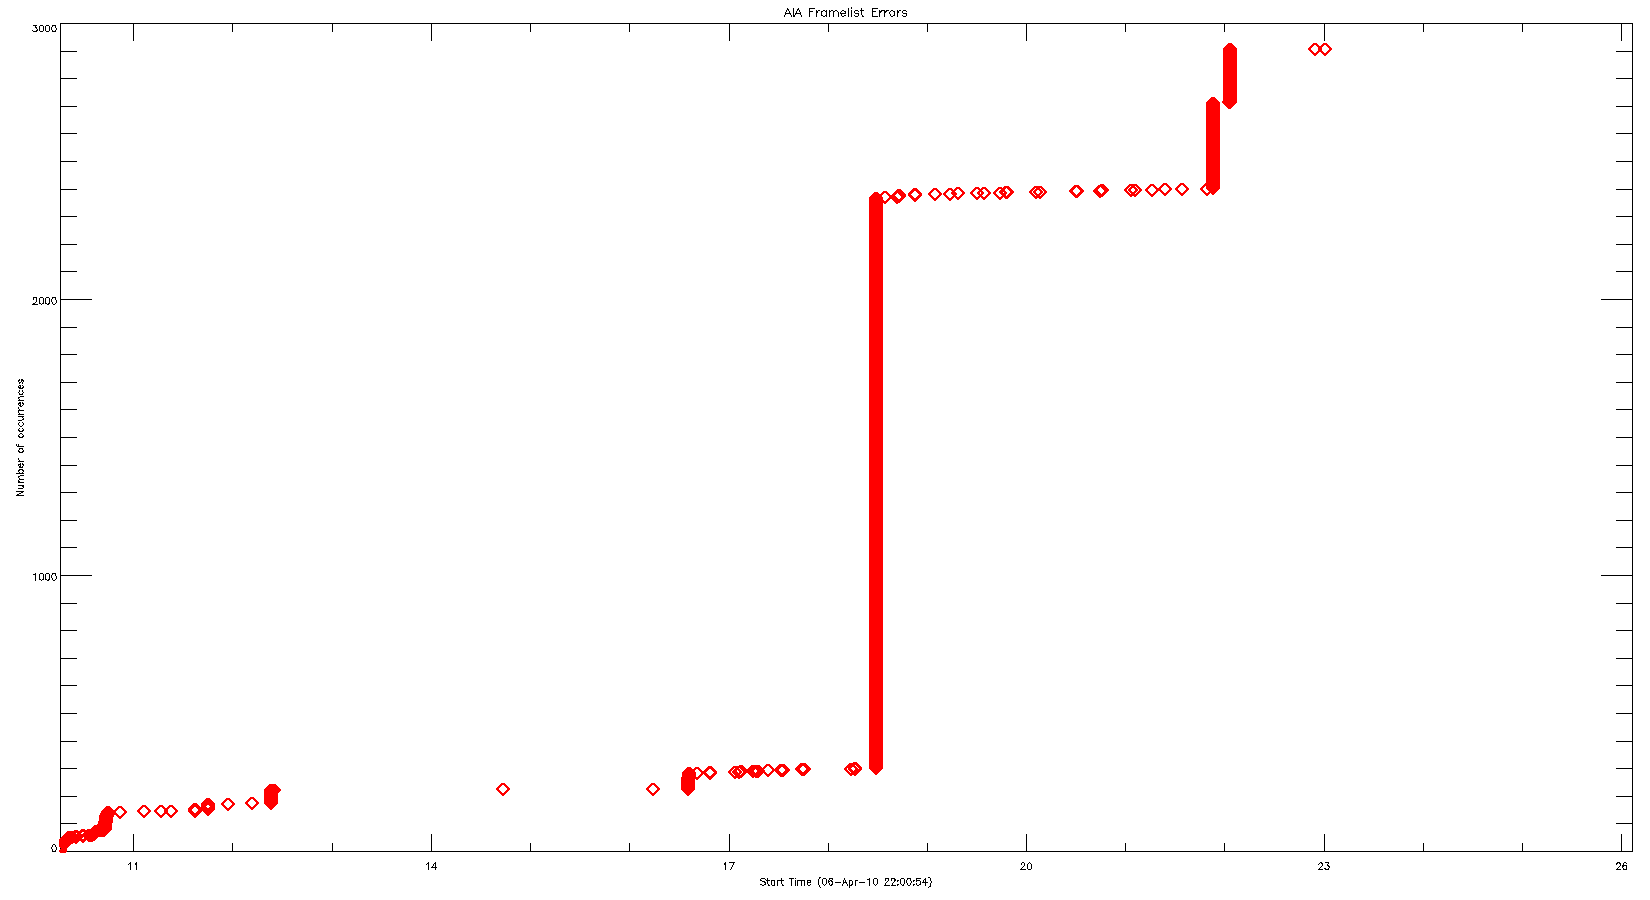
AIA Camera Link Not Ready Errors
Top